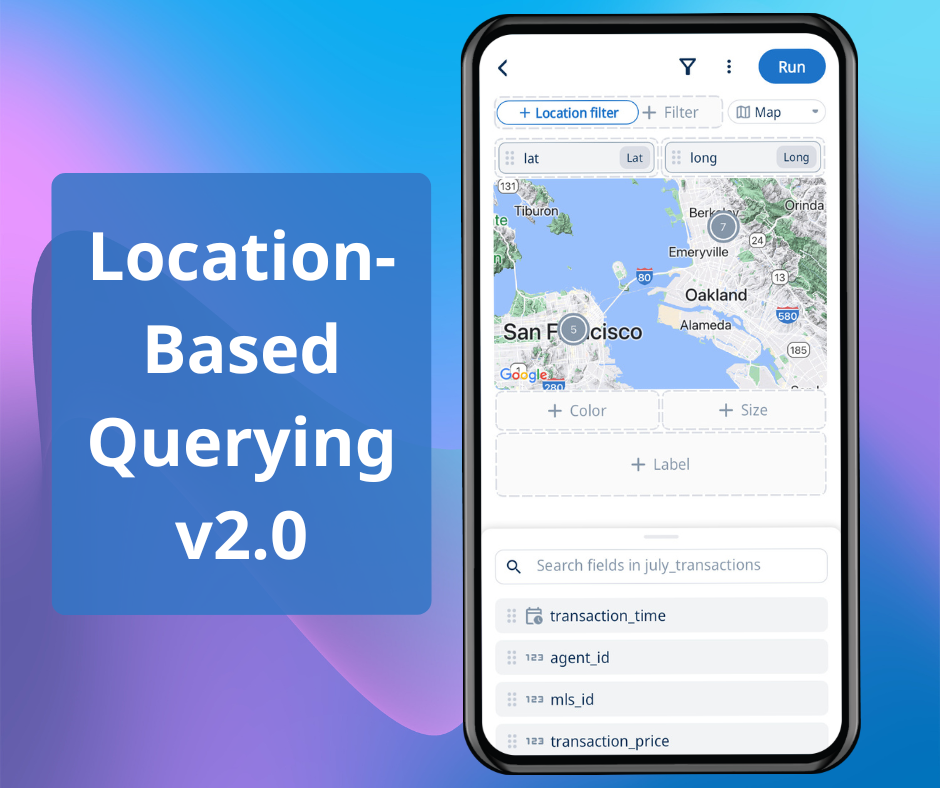
We are excited to announce some major improvements to the way you visualize location-based data on maps! Being able to work with real-time data of entities at different locations, on mobile, is a powerful capability for many of our users. That is why since our initial release of location-based querying, we have been gathering feedback from users and thinking about how to improve their experience with map data.
Now, our SwiftQuery editor presents a more intuitive interface for users to query location-based data - by simply dragging and dropping fields. Users can also customize the color and size of each pin’s appearance on the map!
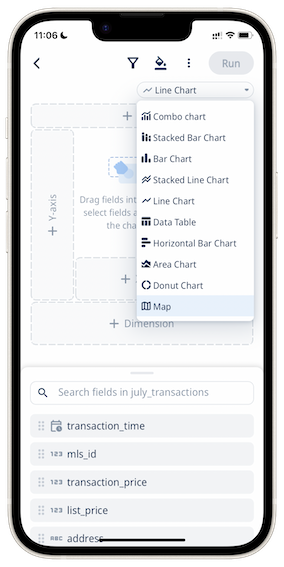
Open up SwiftQuery editor within a data source
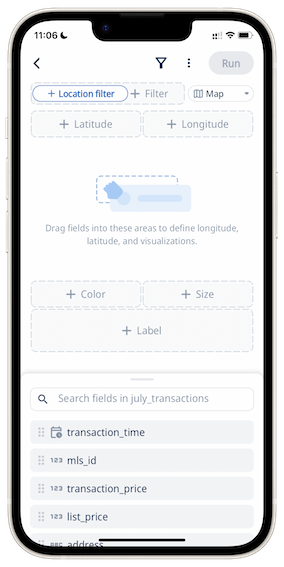
Click the drop down for chart types and select “Map” as the chart type


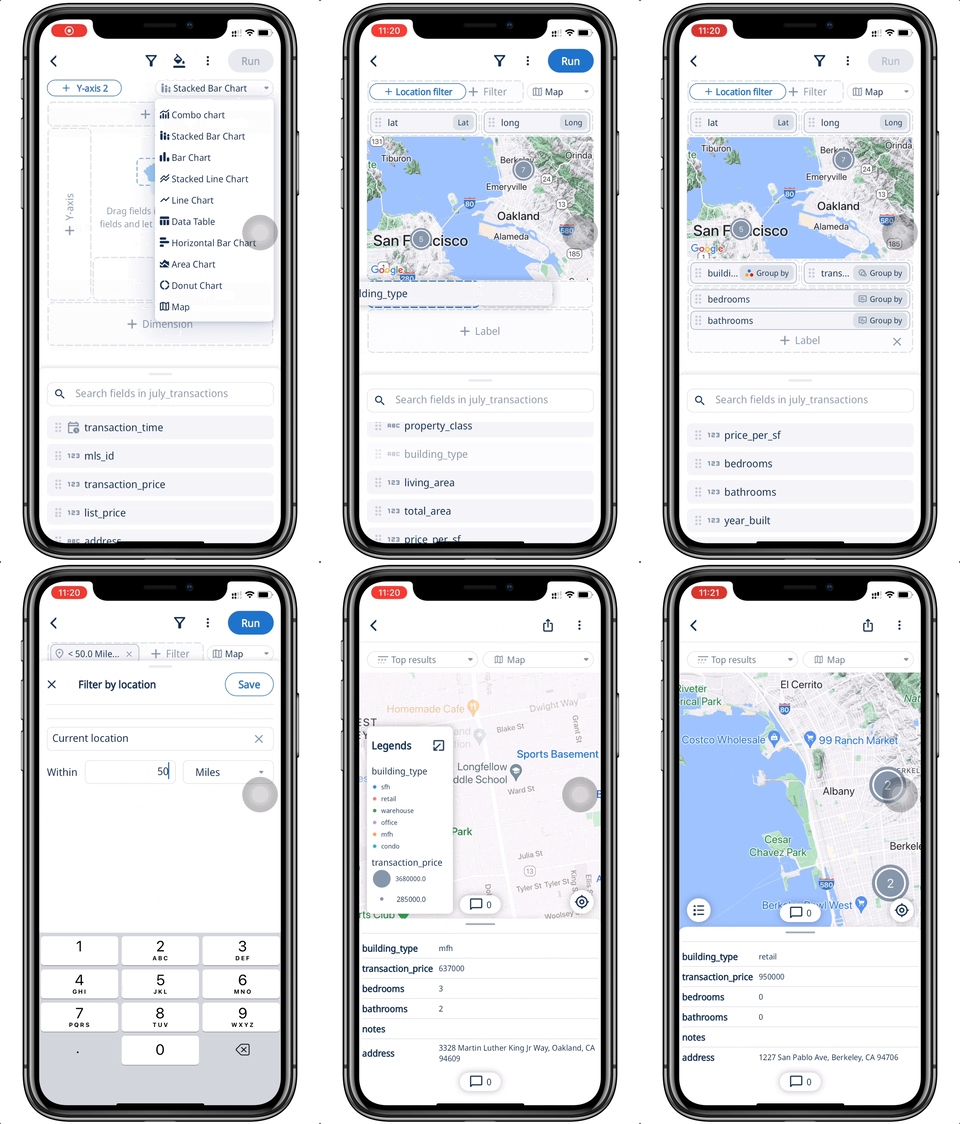
In the above demo, a real estate agent uses Zing to build a mapview of property transactions made in the past month, to be shared with his clients. The agent sets each pin’s color based on the type of property it is: single family home, office, warehouse, etc.; and sizes each pin based on the corresponding property’s transaction price. In doing so, he paints a clear overview for his clients on the recent property market activity.
This is just one out of many use cases, get started and find more details in the docs.
Available on iOS, Android, and the web
Learn how Zing can help you and your organization collaborate with data
Schedule Demo