Text, Image, and Web Page Dashboard Widgets
Dashboards can now include text, links, images, and embedded web pages. This allows you to provide supplemental text, enhance your company’s branding, or embed other up-to-date information from the public web all alongside your company’s data.
To learn more about our existing interactive filters for dashboards please go here.
Dashboards are no longer just about numbers and charts. They are becoming powerful storytelling tools. By incorporating images, text, and web pages, you can:
- Enhance storytelling: Visuals can complement your data, making it easier to understand and remember key insights.
- Add context: Explain the story behind the data with rich text, providing additional details and explanations.
- Integrate external information: Embed relevant web pages to bring in up-to-date data or external resources.
- Create branded experiences: Customize your dashboards with your company’s branding and imagery.
- Improve user engagement: Make your dashboards more visually appealing and interactive.
Adding image, text, and web page widgets to your dashboard is simple. Just follow these steps:
- Create a new dashboard or open an existing one.
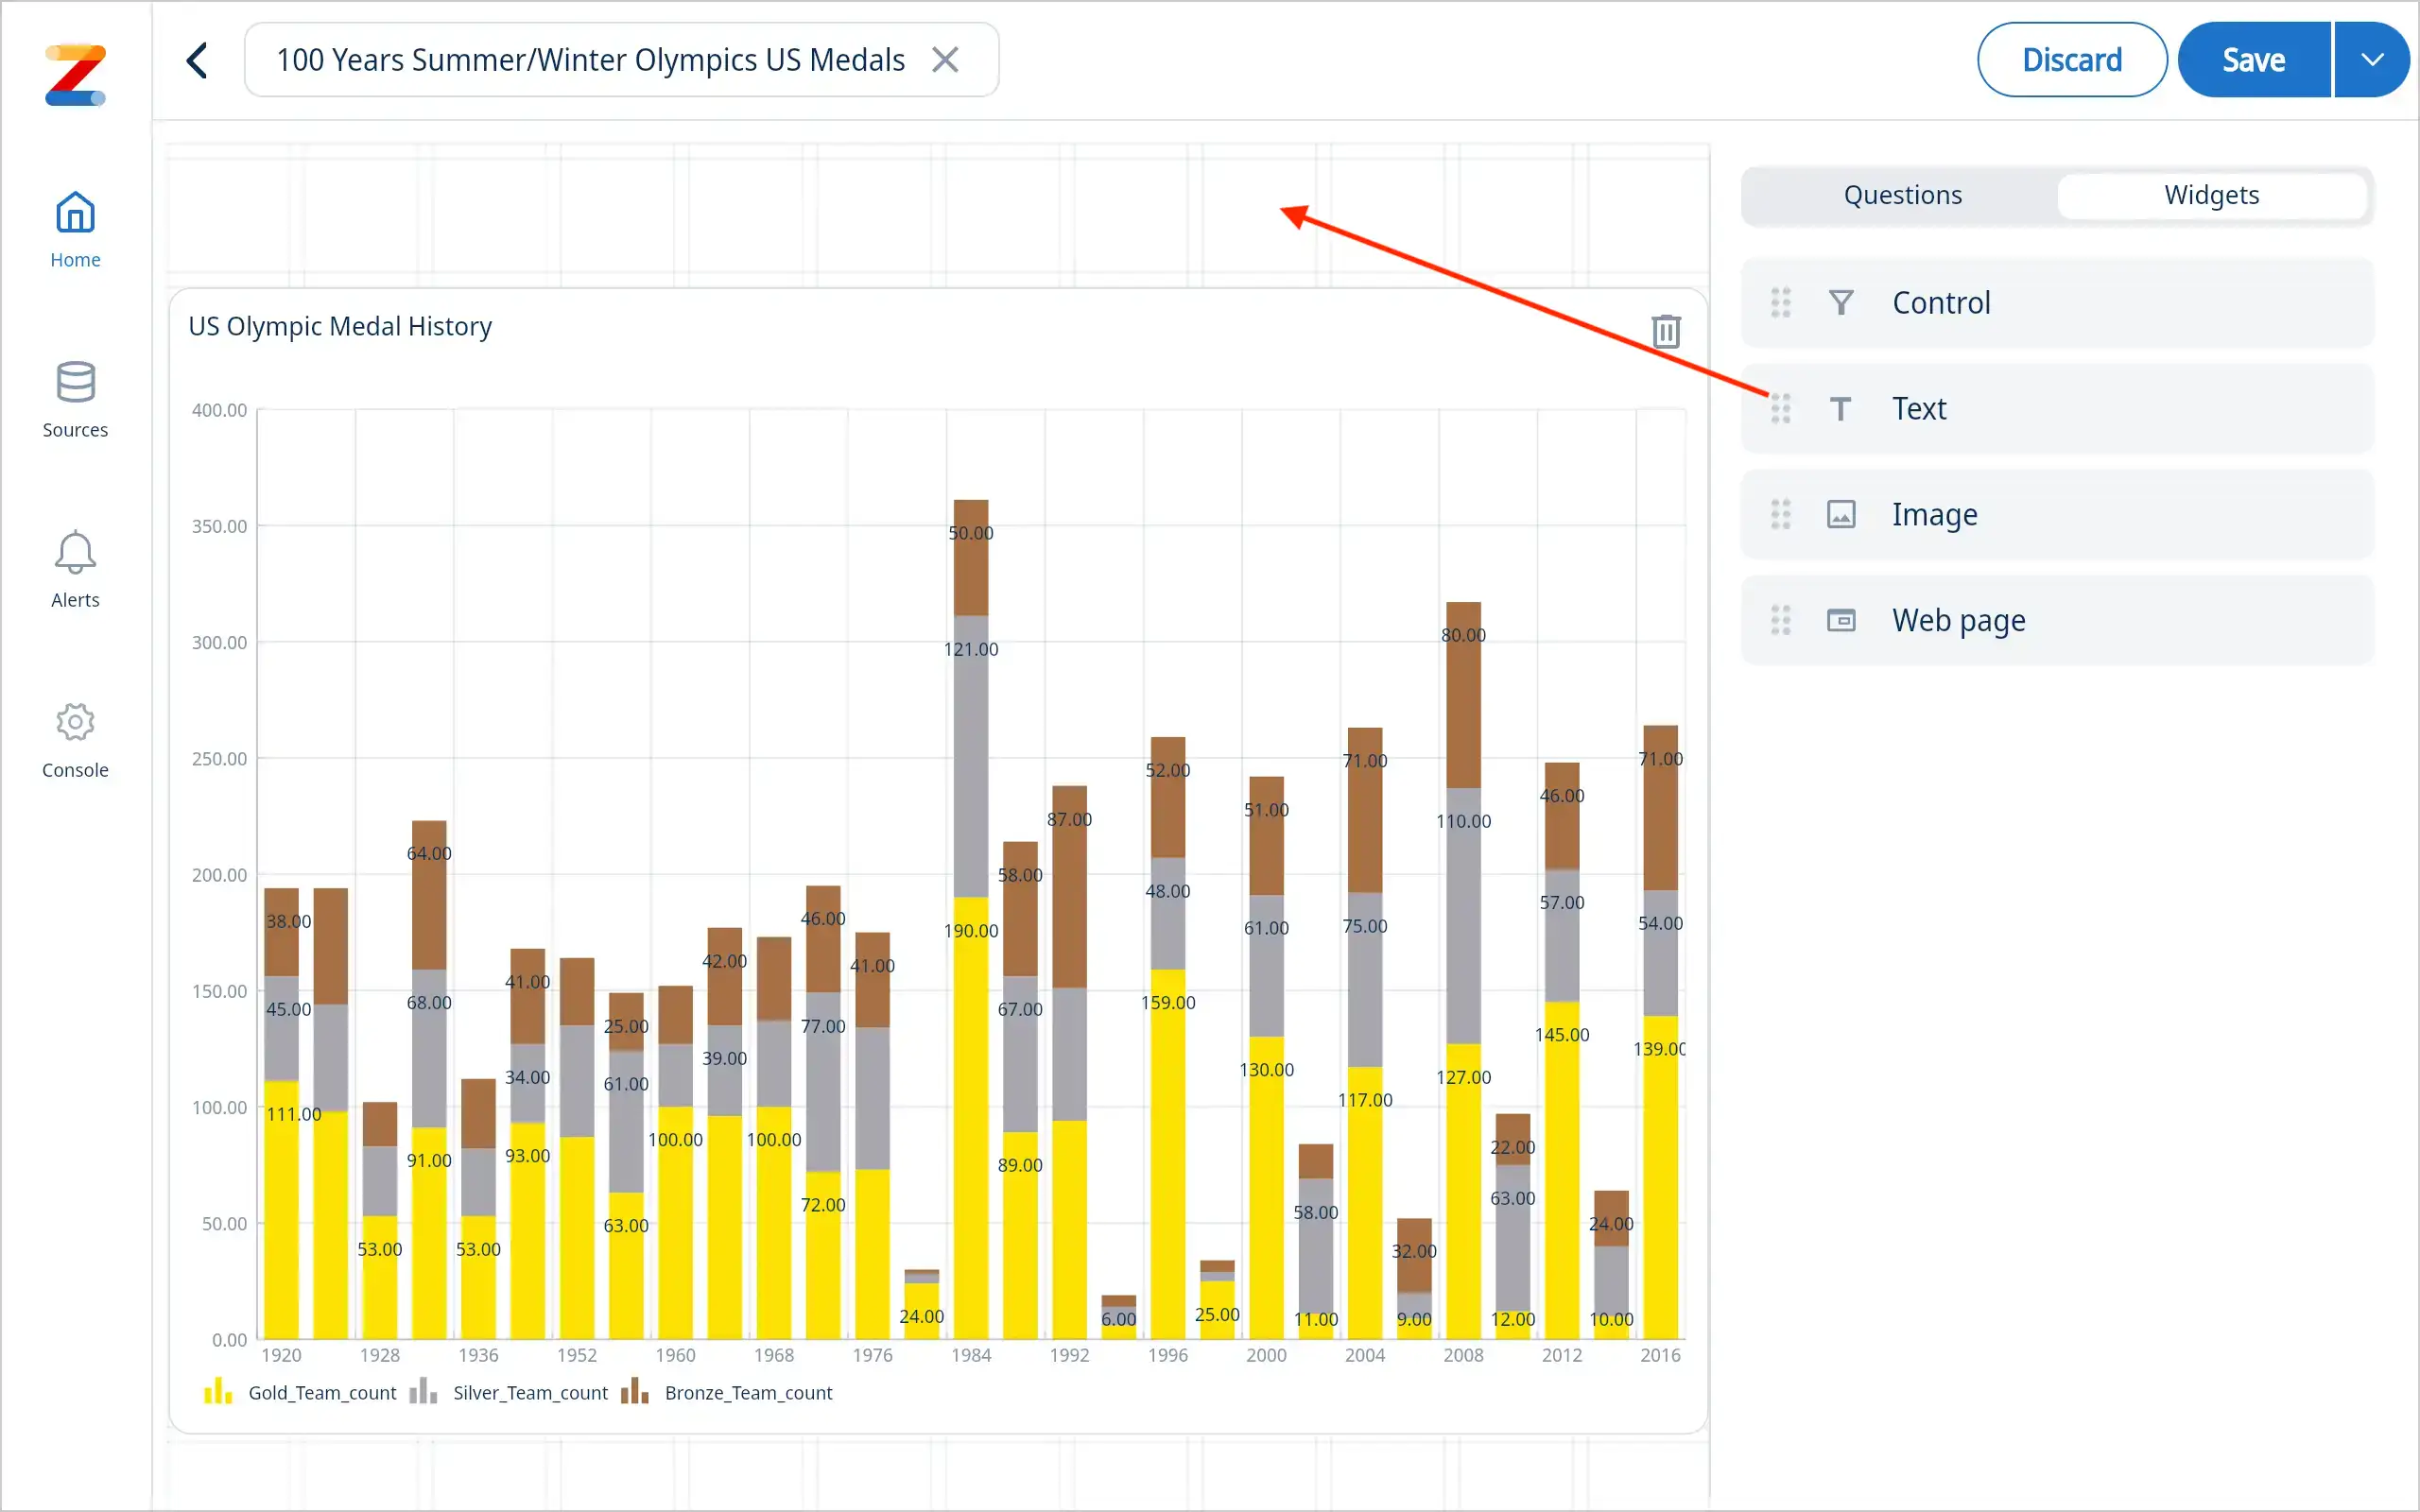
- Select the desired widget from the widget library from the right hand panel » see screenshot below
- Customize the widget with your content. You can upload images, write text, or embed web pages using the provided options.
- Position the widget on your dashboard to create the desired layout. You can resize widgets to any size and proportion you wish.
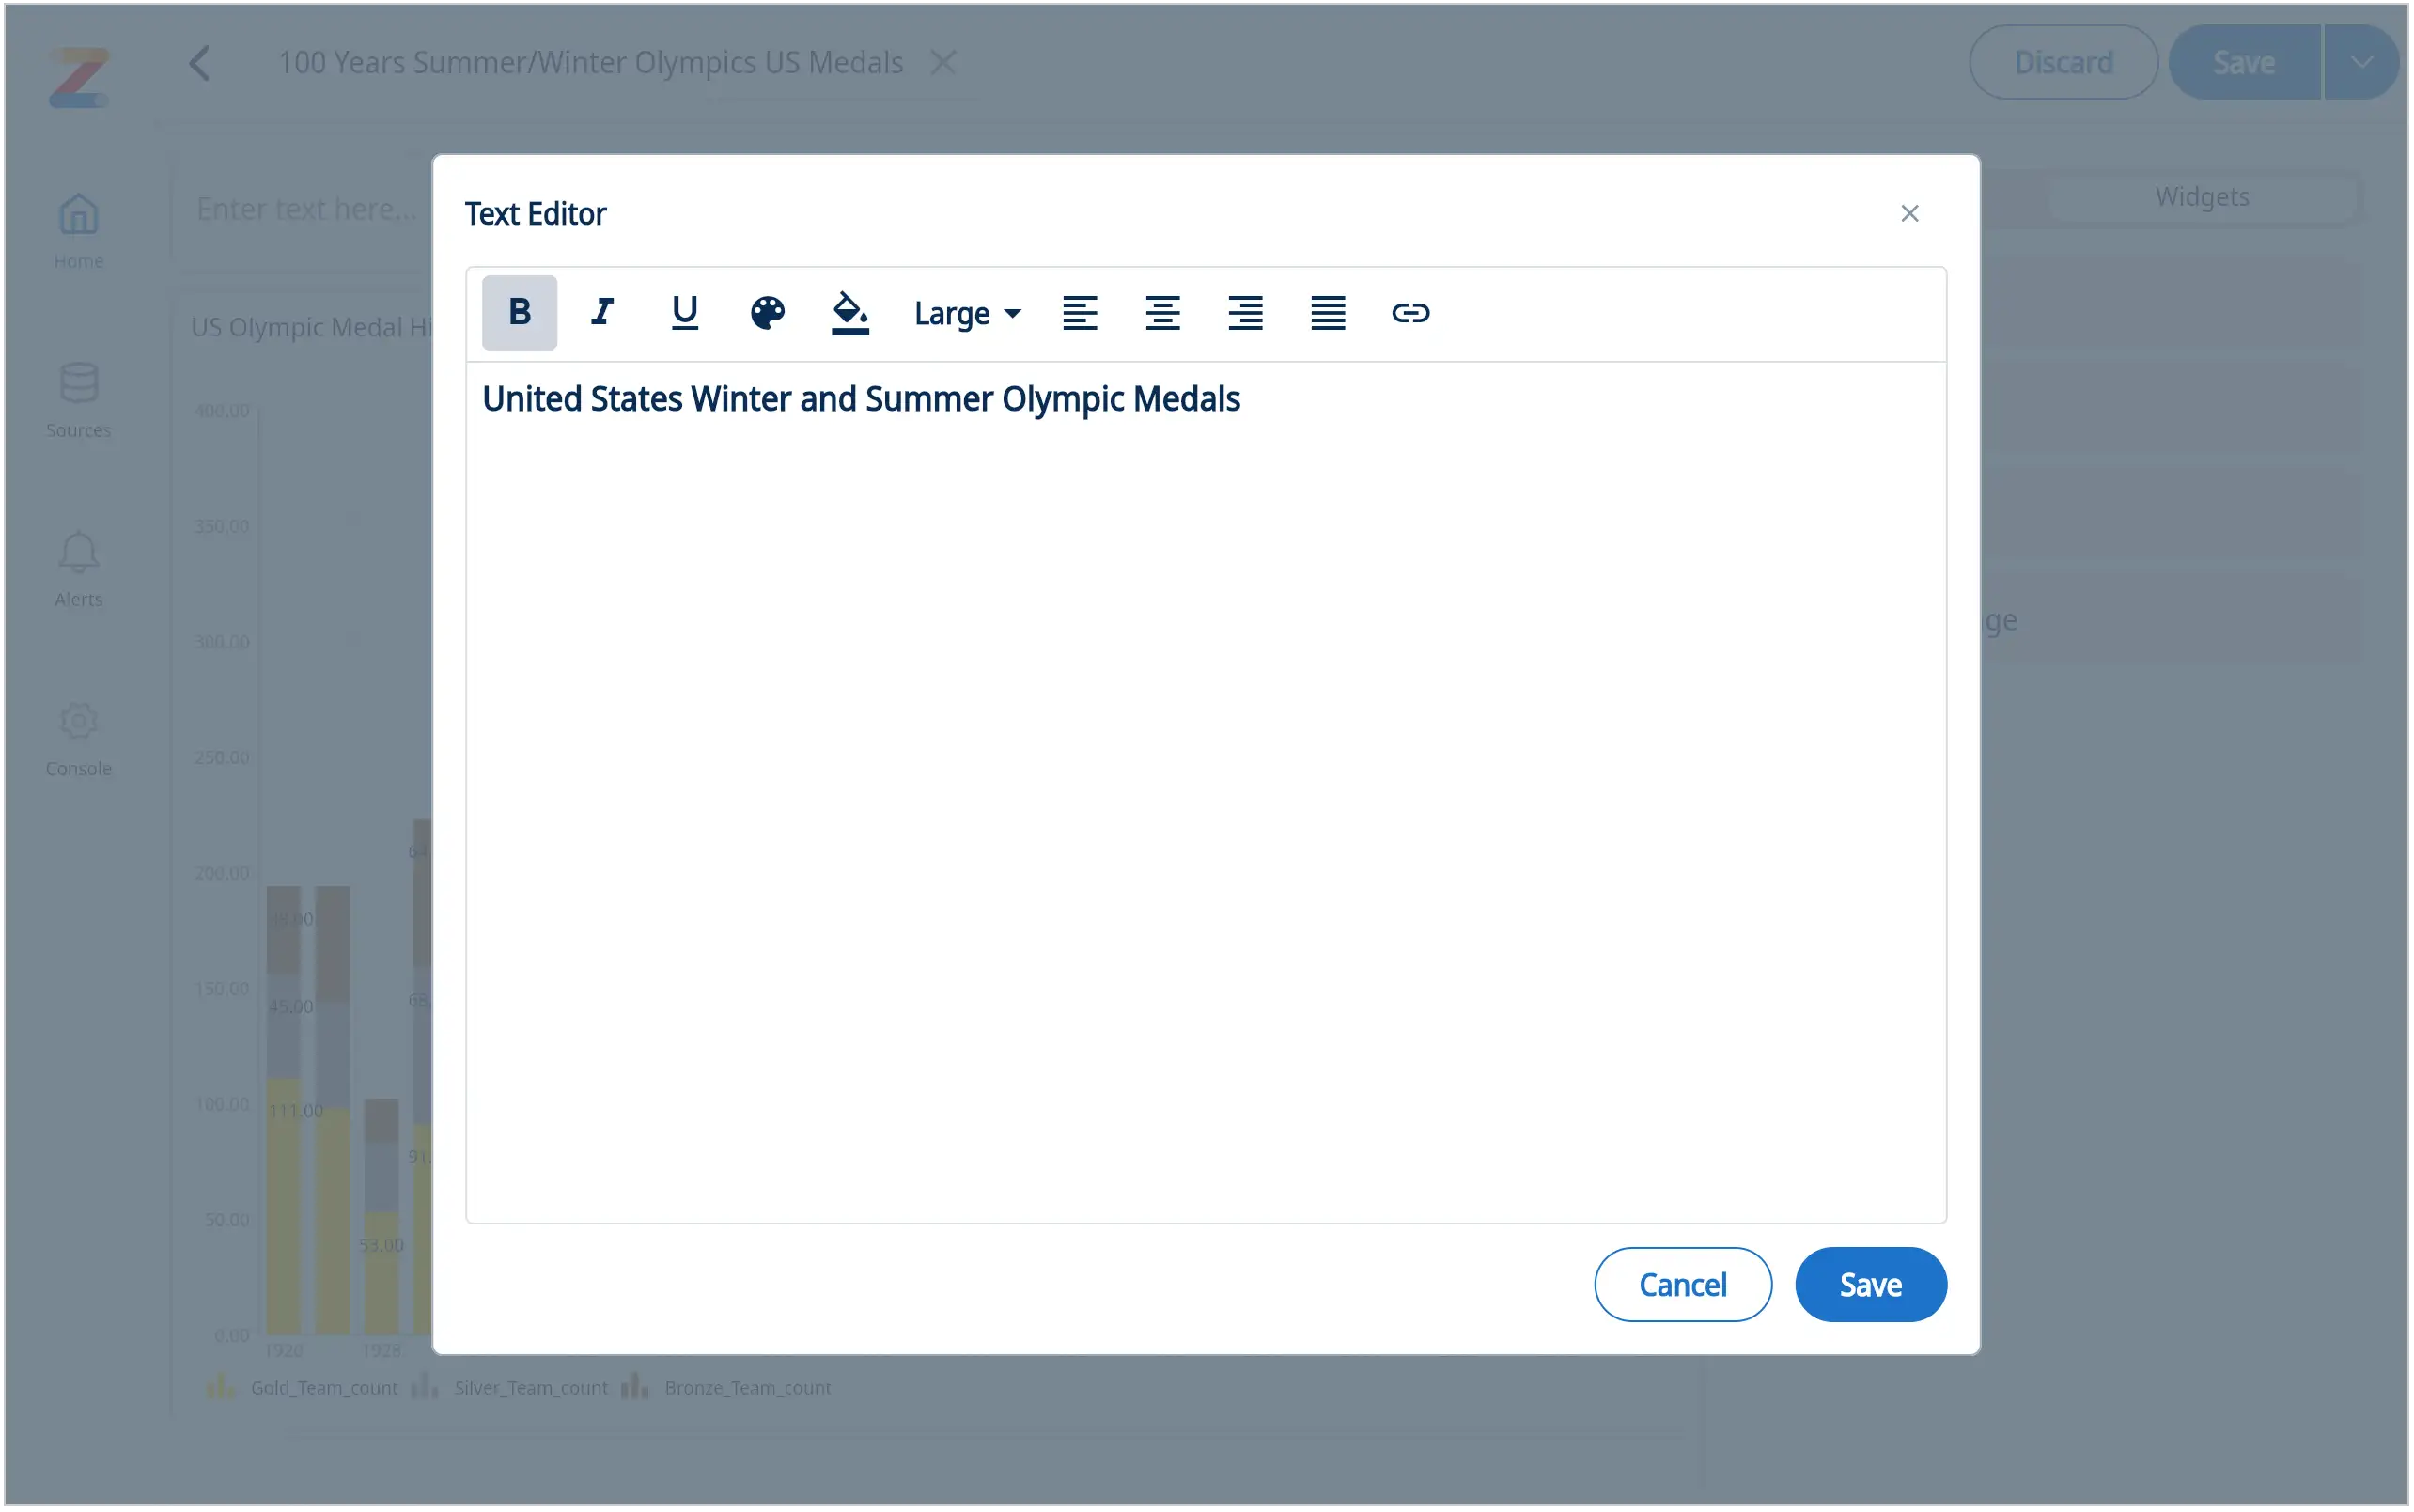
Add text: change font size, color, alignment and add links
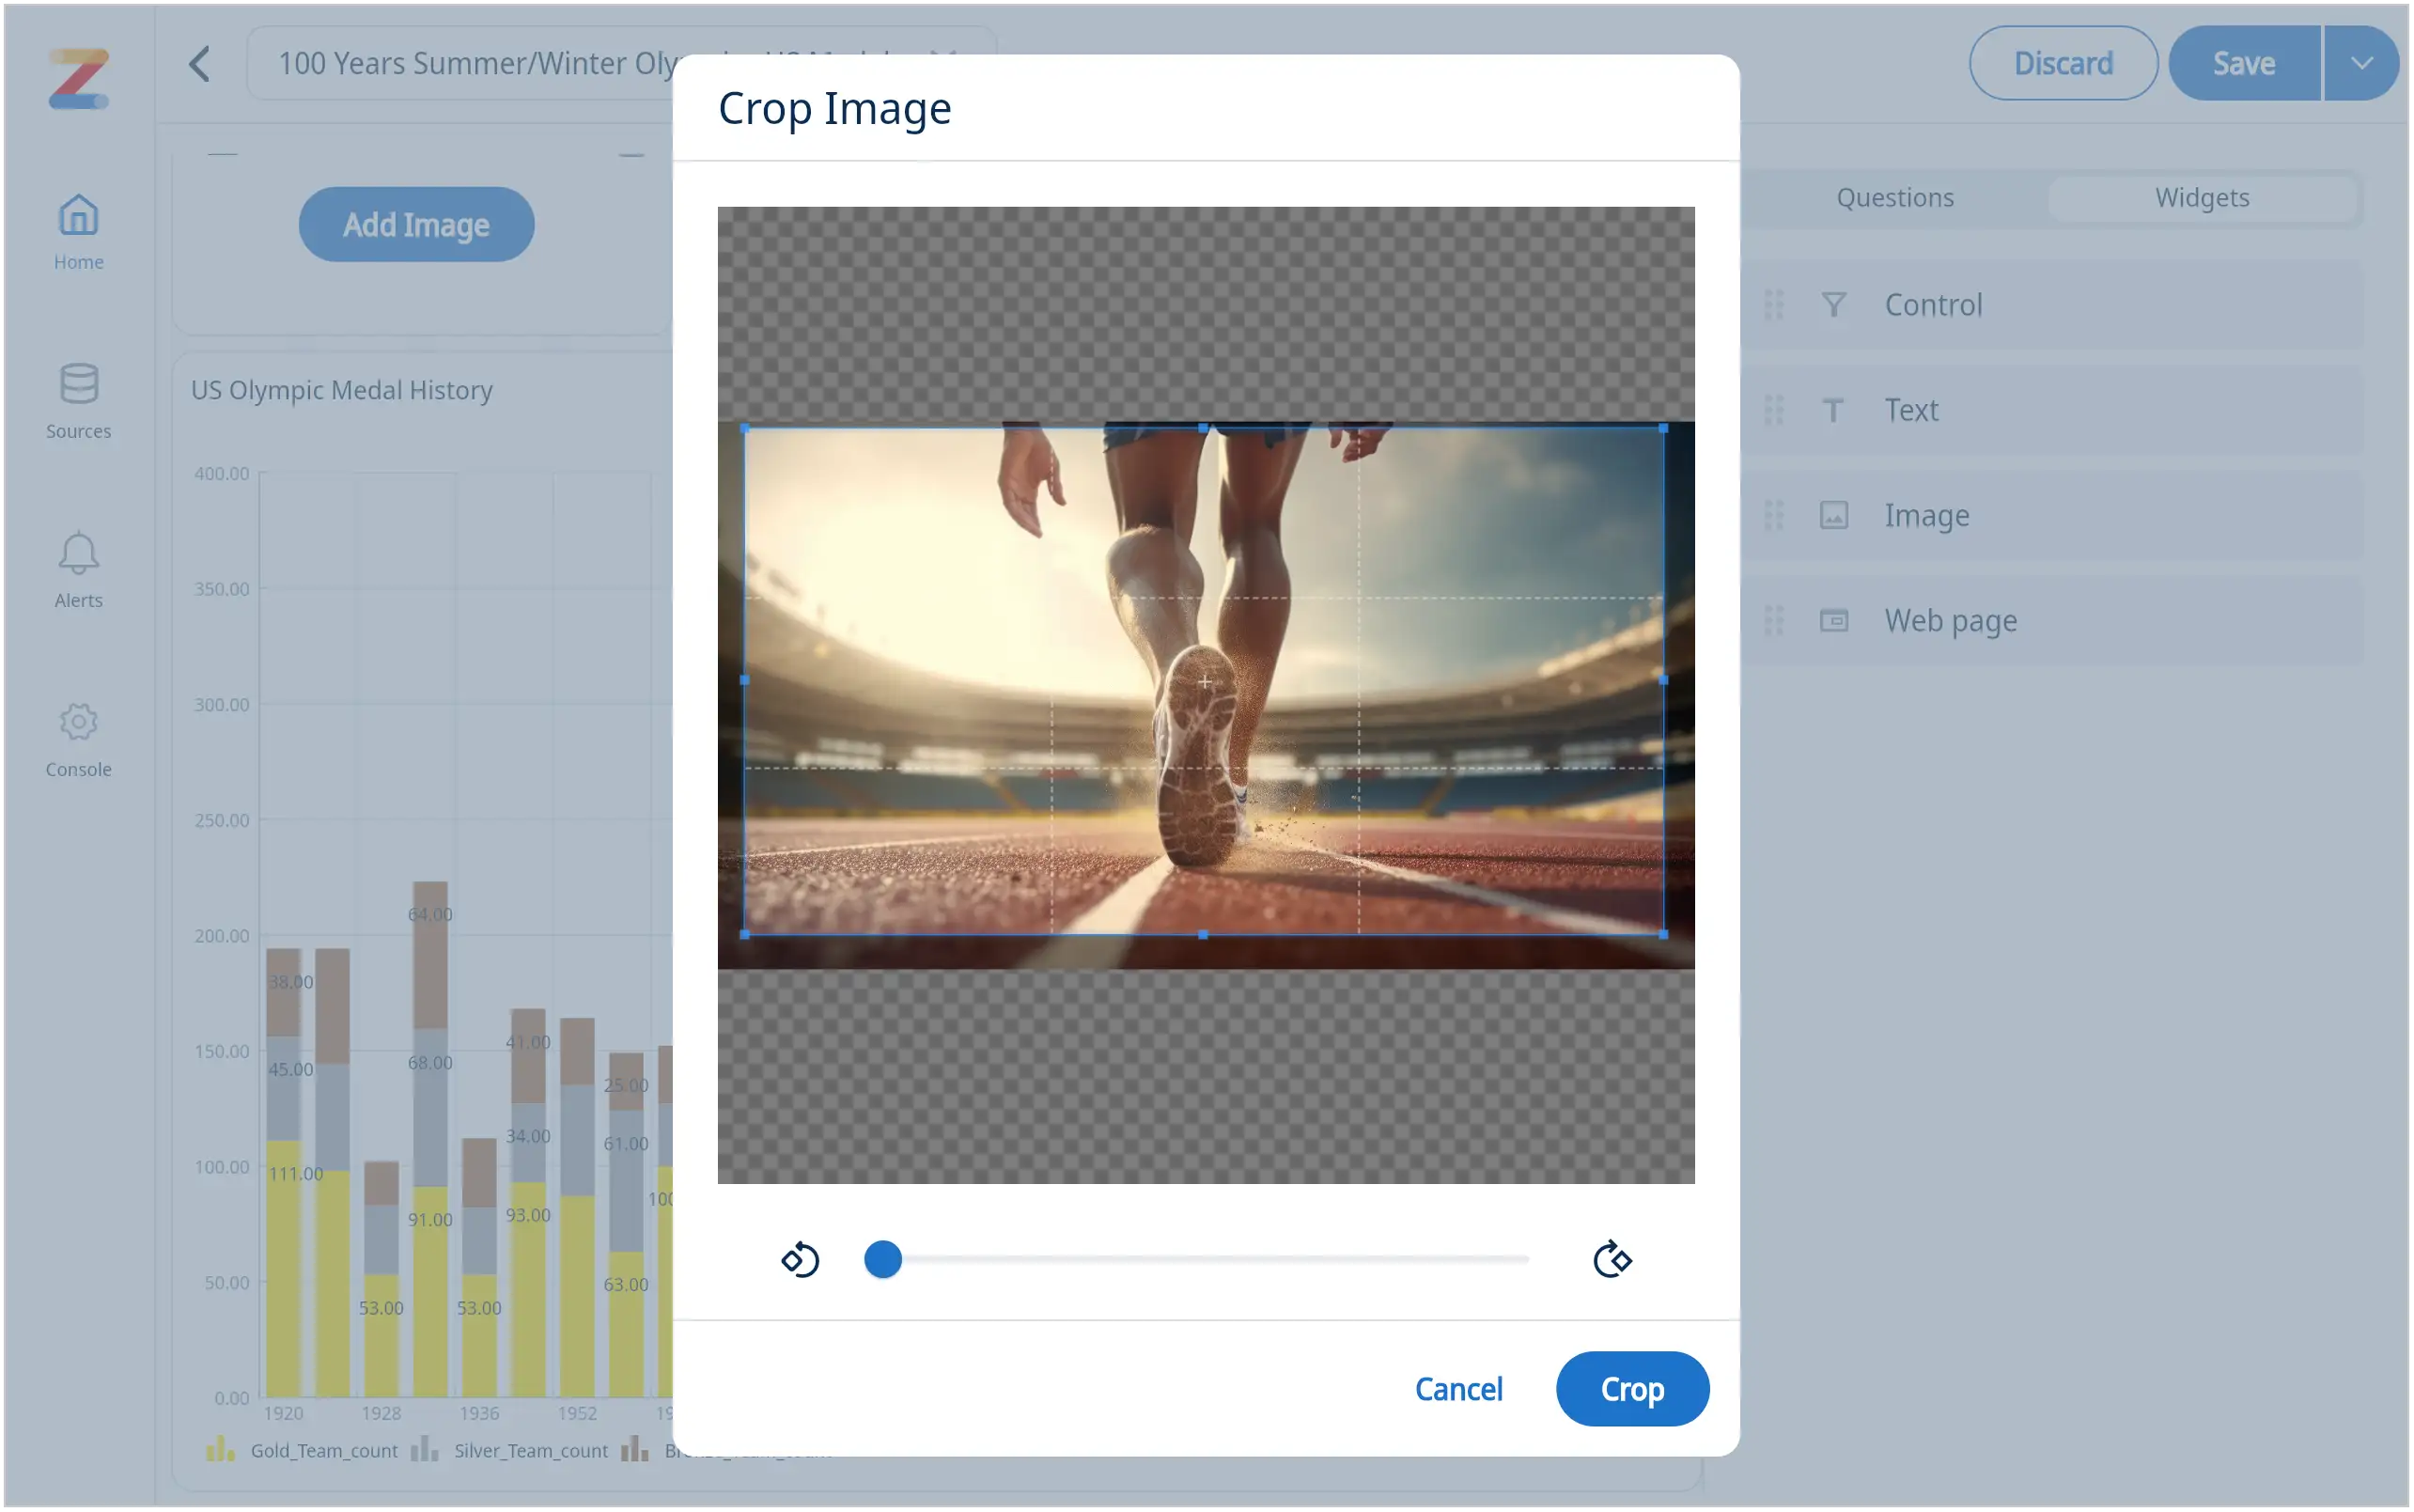
Add an image: resize and crop for the best fit
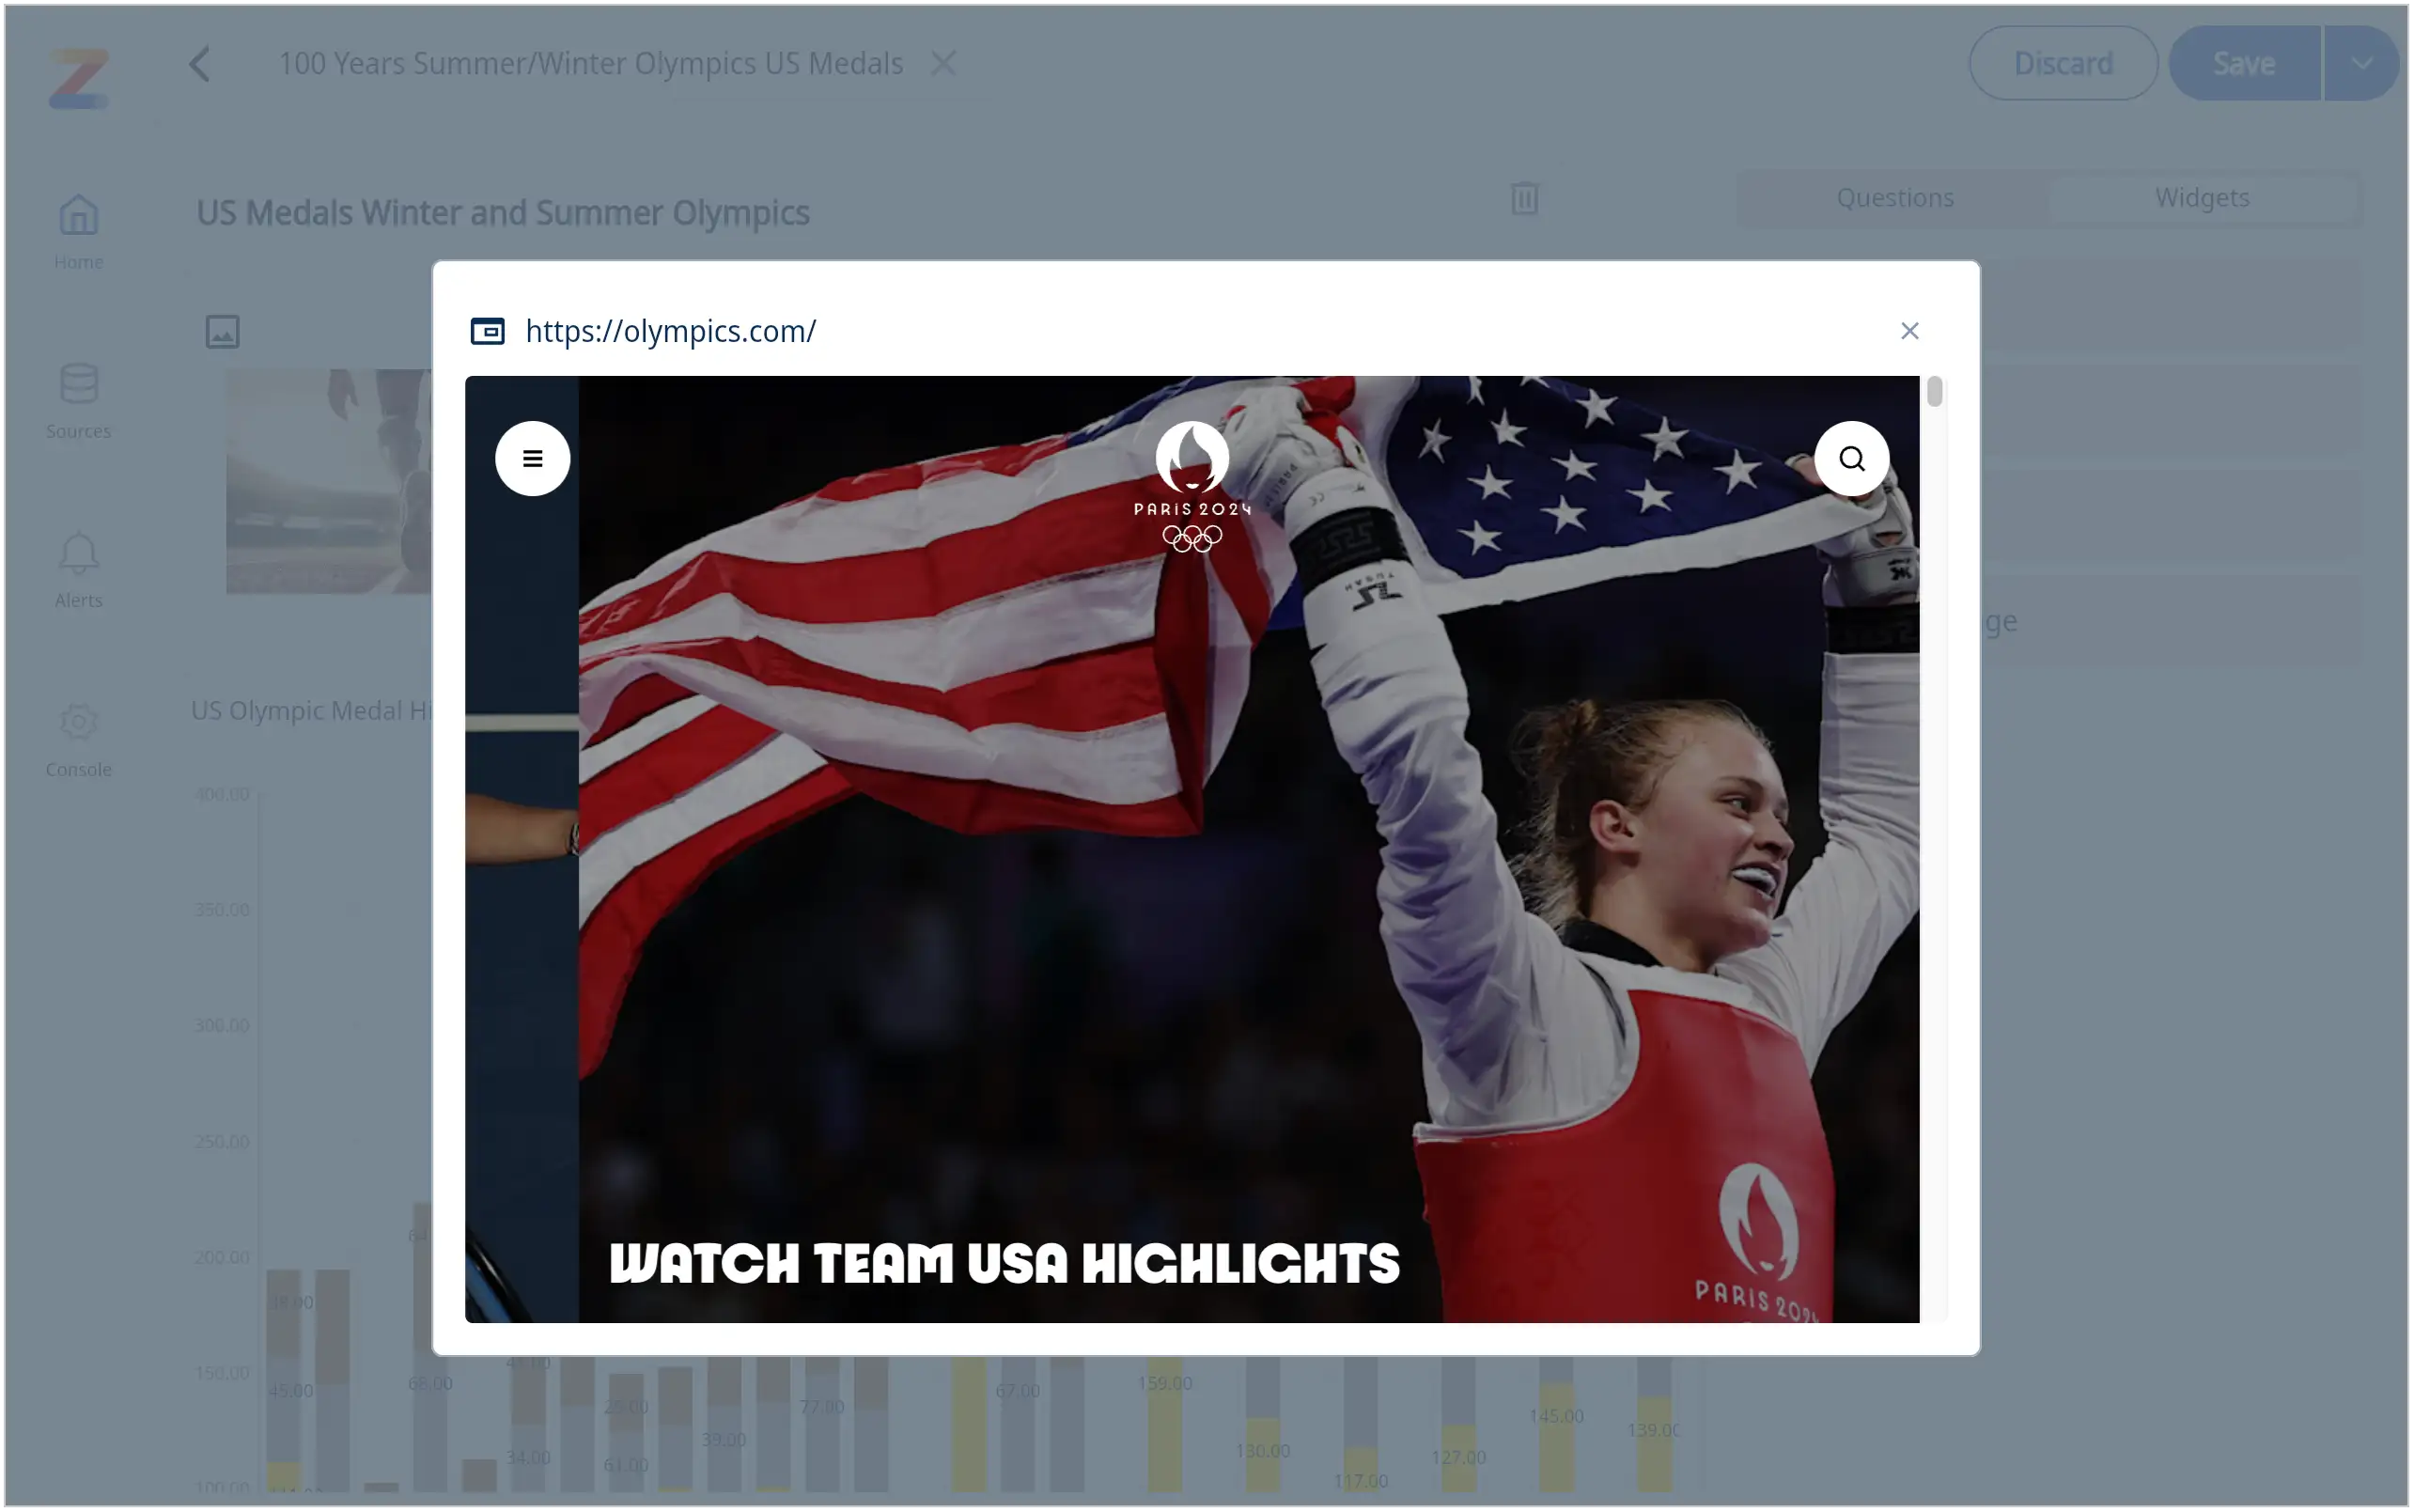
Add a web page
Unleash Your Creativity
With these new widgets, the possibilities are endless. Here are some ideas to get you started:
- Create a marketing dashboard with product images, sales figures, and customer testimonials.
- Build a financial dashboard with company logos, key financial metrics, and links to relevant reports.
- Design an HR dashboard with employee photos, performance metrics, and company culture information.
- Develop a customer support dashboard with customer feedback, support tickets, and knowledge base links.
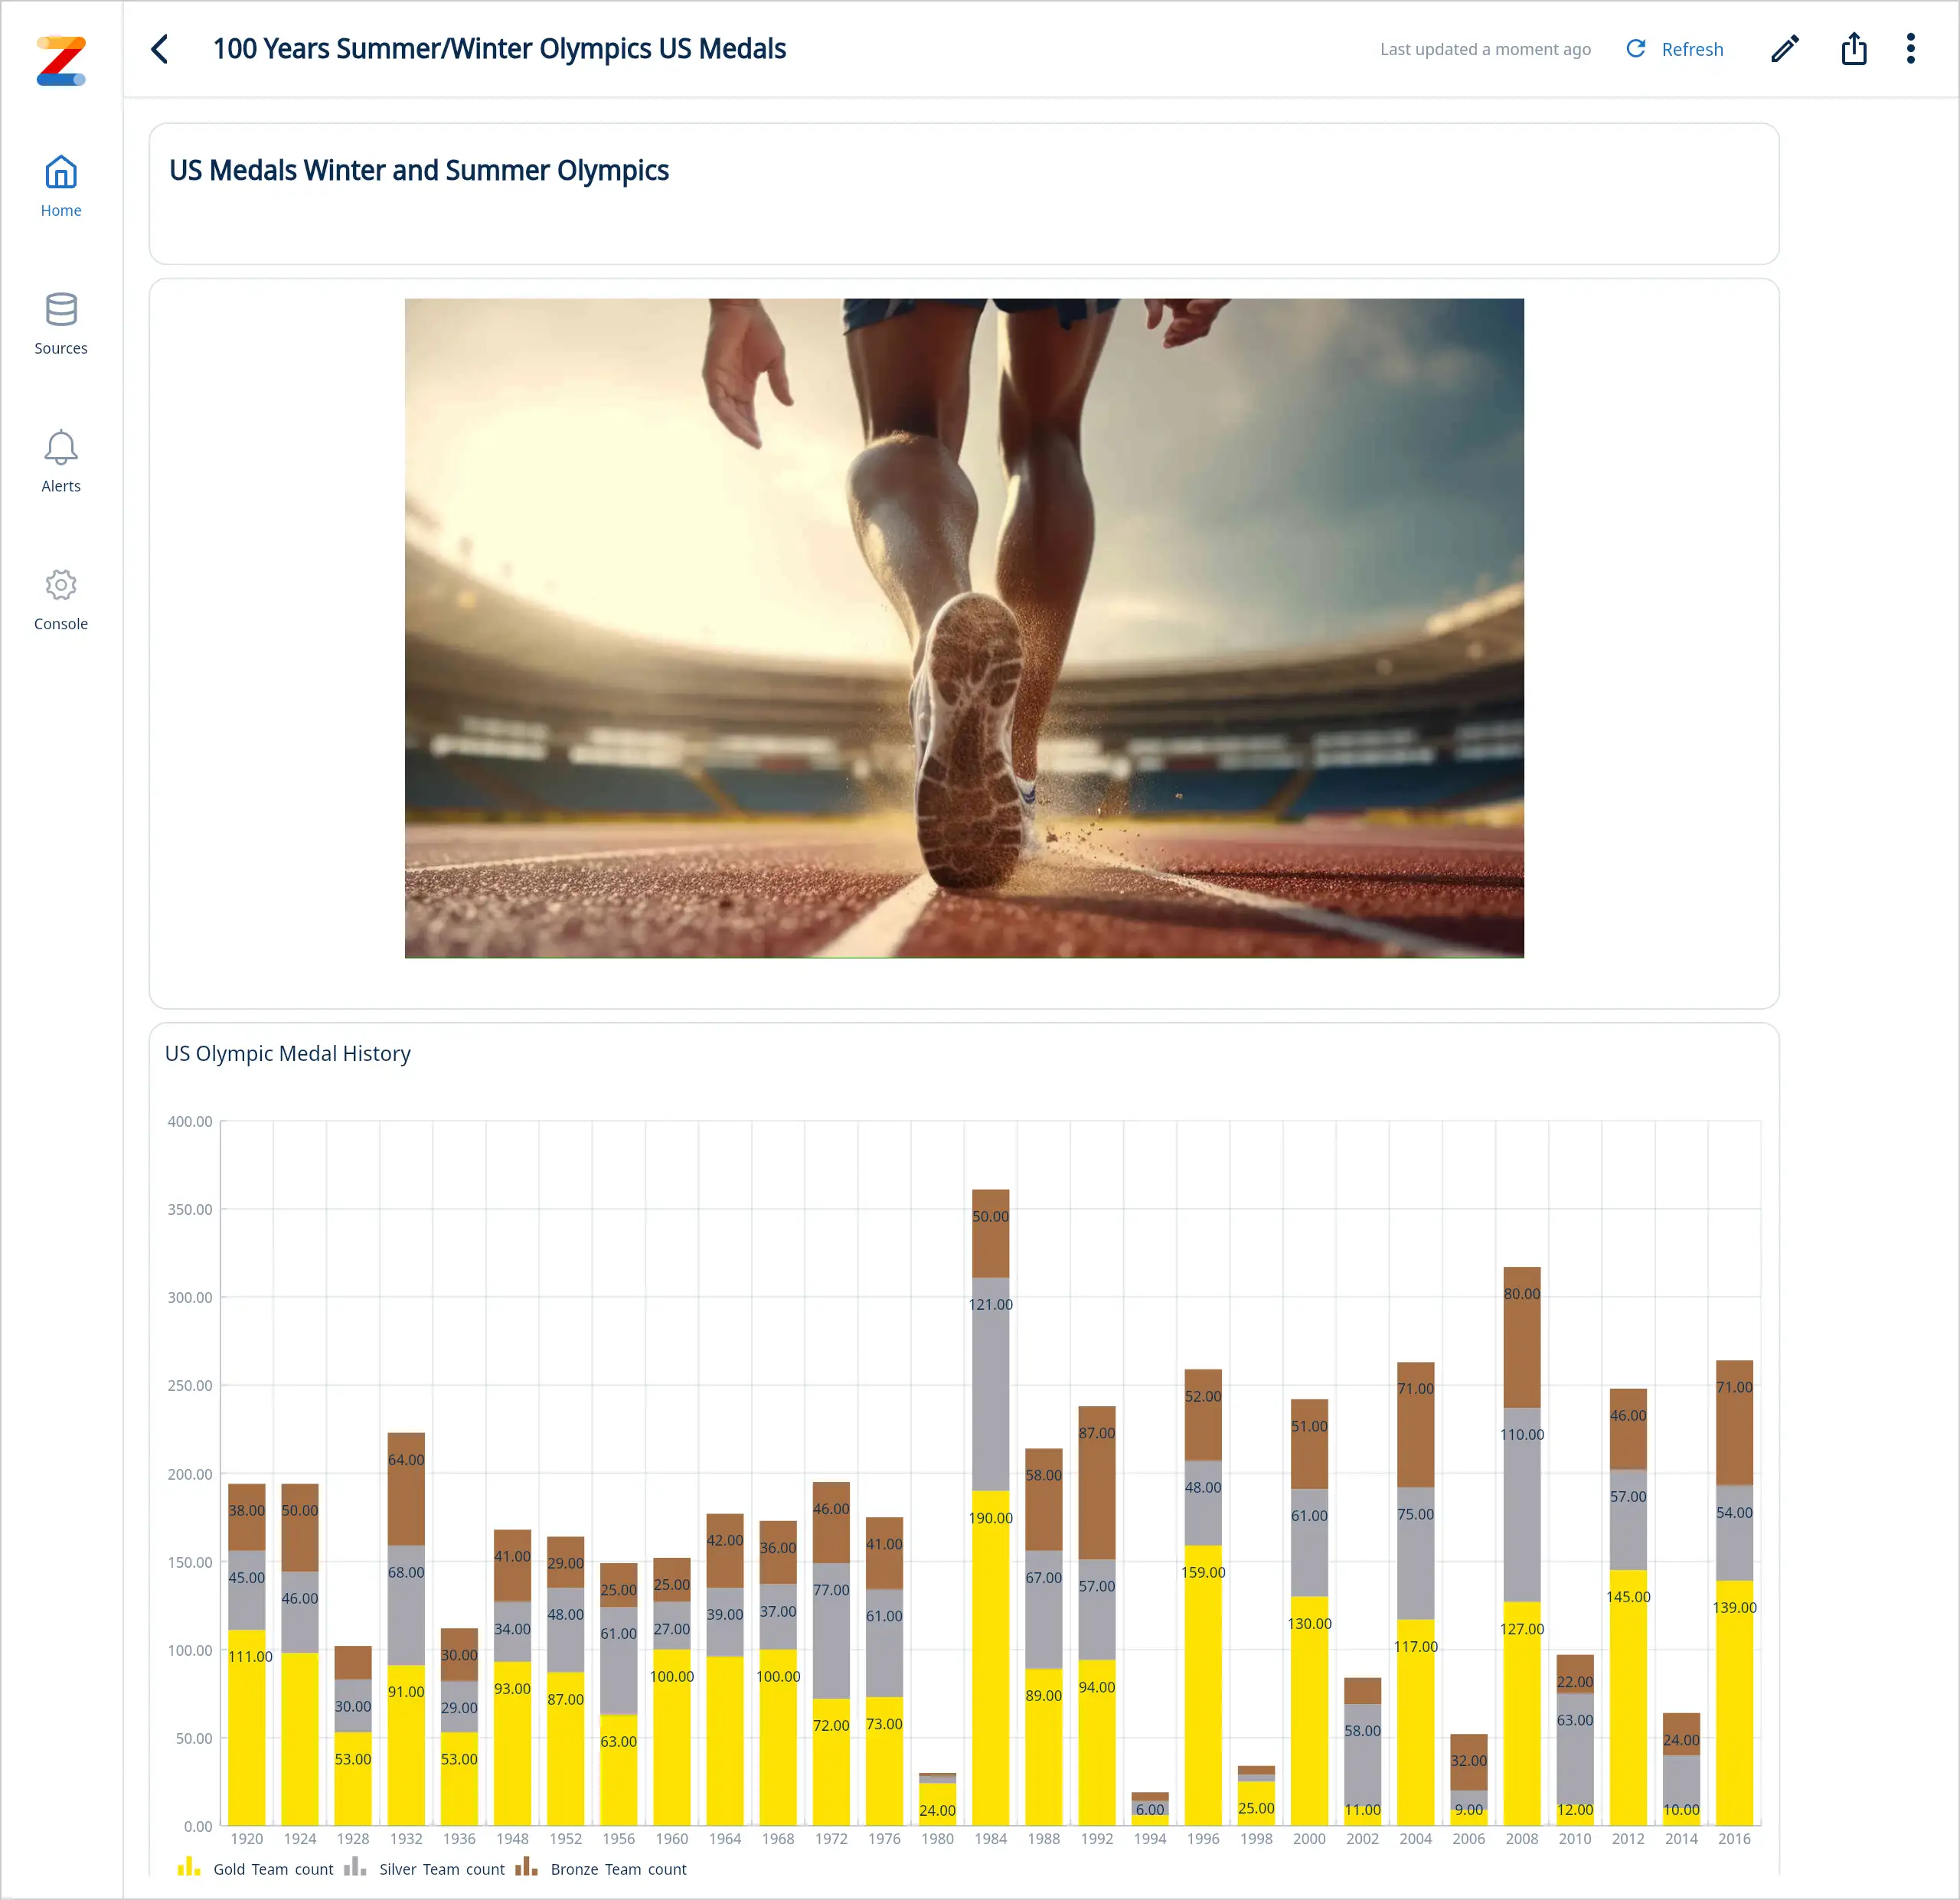
Here is a sports related dashboard example with custom text and images
Get started for free! Sign In or create a new account.


