Create interactive filters on dashboards so people can apply filters to one or multiple questions in a dashboard to quickly. This works for all questions in Zing created with natural language, or with the visual query builder.
Dashboards can now:
Of course, you can modify filter values on web, iOS, and Android.
Controls and filters on dashboards ensure effective governance of the user experience, providing a structured yet flexible environment where collaboration and data security are seamlessly integrated. Of course you can allow users to go beyond the filters on a dashboard to instead ask questions from scratch with natural language querying, visual querying, or the built in SQL editor if they have appropriate editor / admin permissions. Viewers can be limited to applying filters that already exist.
Step 1: Ask questions using your data source
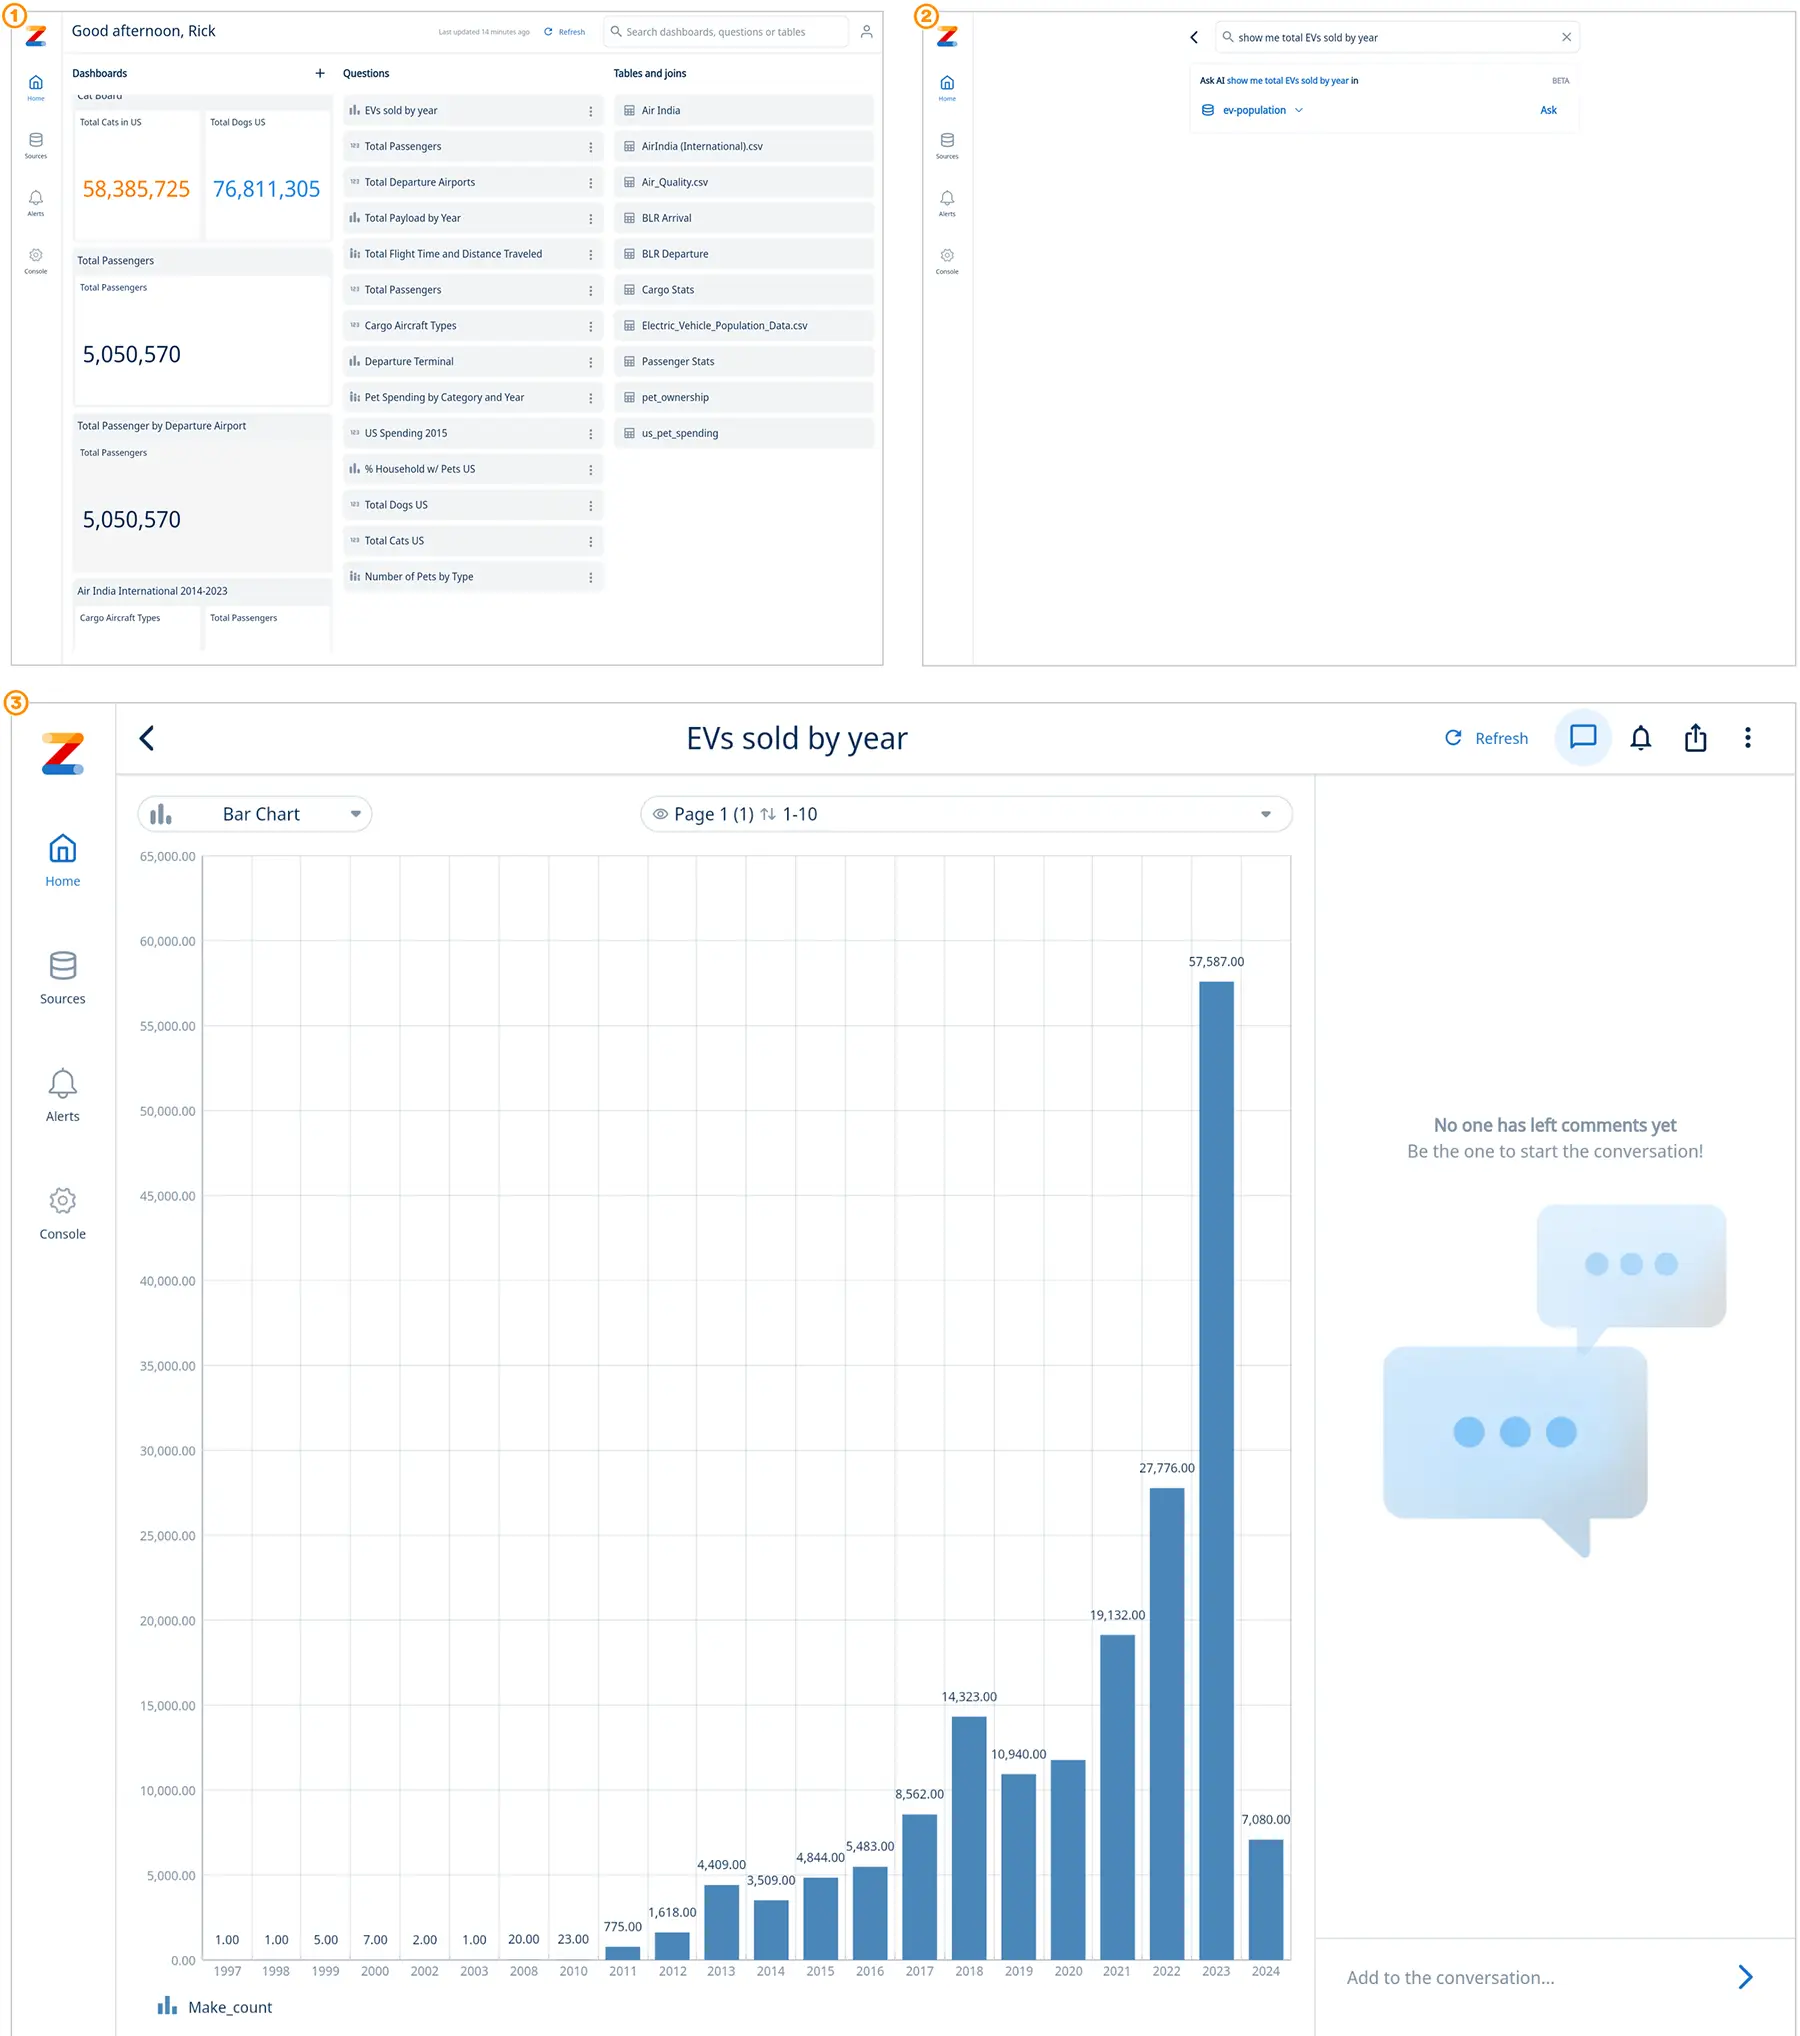
Step 2: Create a new dashboard, add your questions and controls
Controls are basically filters, customized for dashboard purposes. With Zing’s dashboard controls you can navigate your data with
Step 3: Explore your data in a dashboard and find new insights quickly
An interactive dashboard becomes more than just a tool for data visualization; it transforms into a central platform for data-driven culture, fostering collaboration, learning, and strategic decision-making across your organization.
Get started for free! Sign In or create a new account.
Available on iOS, Android, and the web


Learn how Zing can help you and your organization collaborate with data
Schedule Demo