With Zing Data, you can now integrate your questions and dashboards into your own frontend application. Here’s a primer on how to get started with embedded analytics. You can get started by connecting a datasource to your Zing account. A large variety of datasources are supported by Zing such as Postgres, MySQL, Clickhouse, Microsoft SQL server, Google Sheets, Databricks, Excels and CSVs, etc.
In this example, we’ll connect to a Clickhouse database on Github Event data, then ask a question on Zing. We can then embed this question to your application.
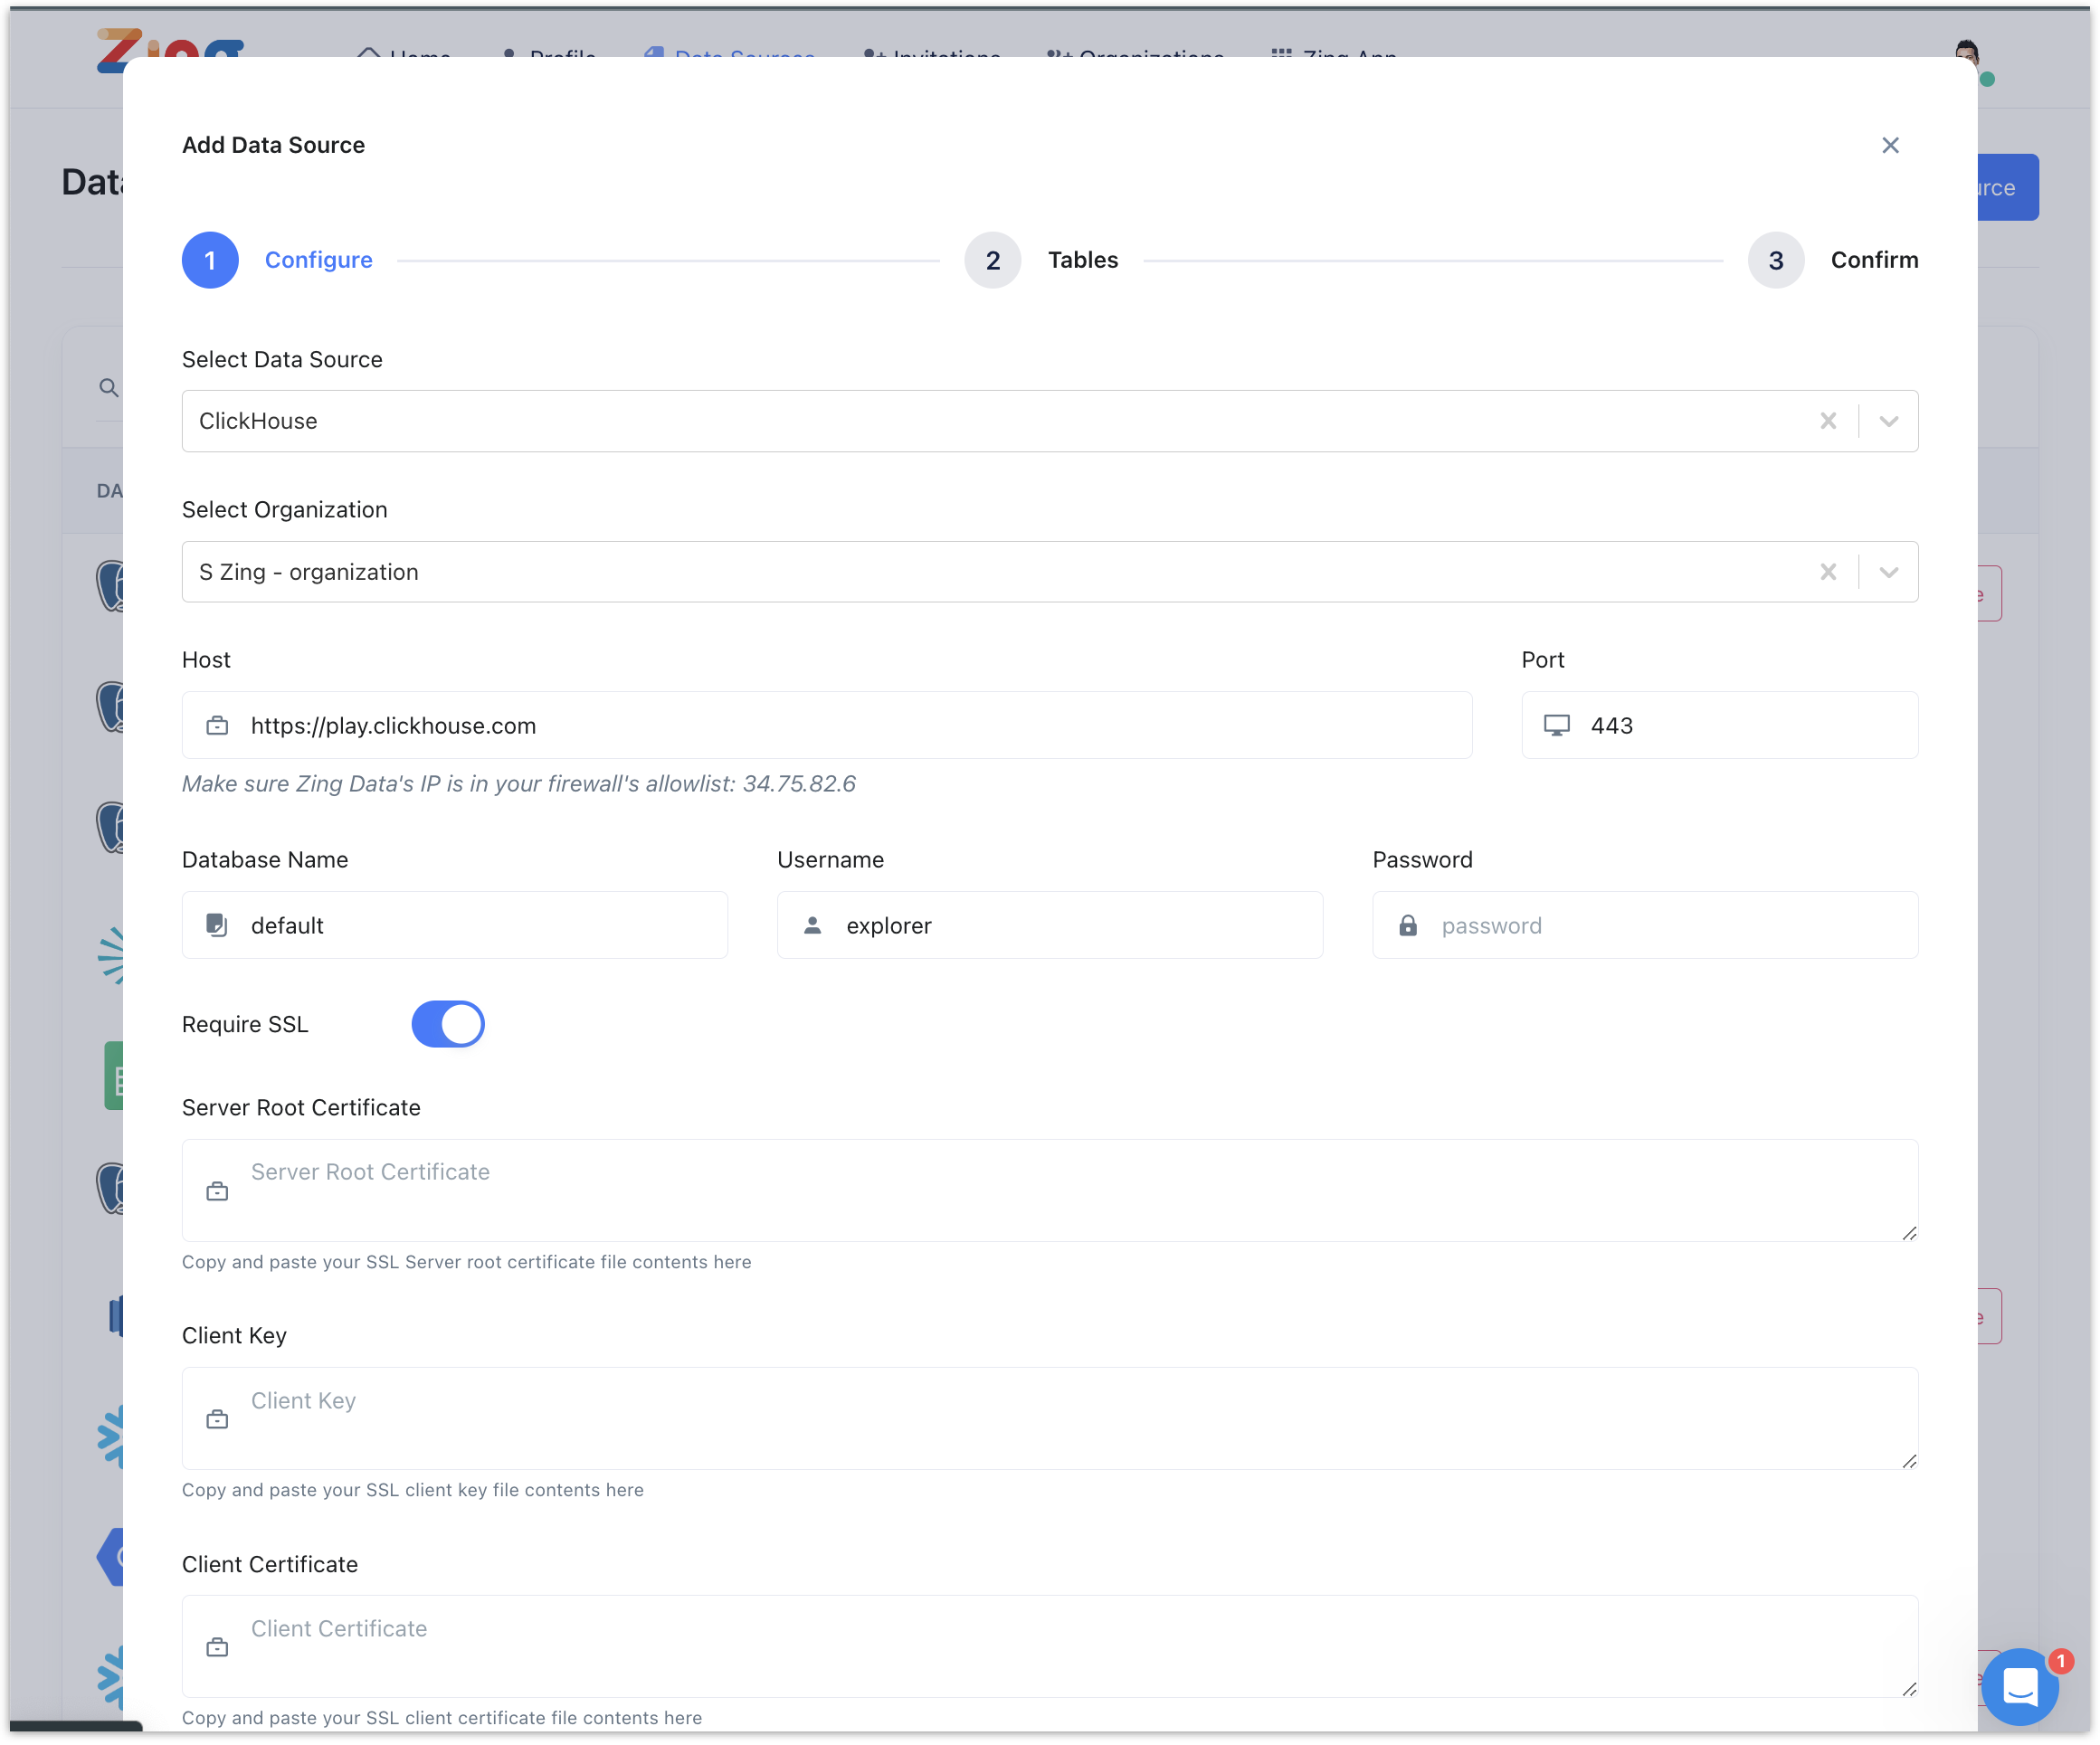
Let’s add a ClickHouse playground datasource with the following credentials.
Host: https://play.clickhouse.com
Port: 443
Database: default
Username: play
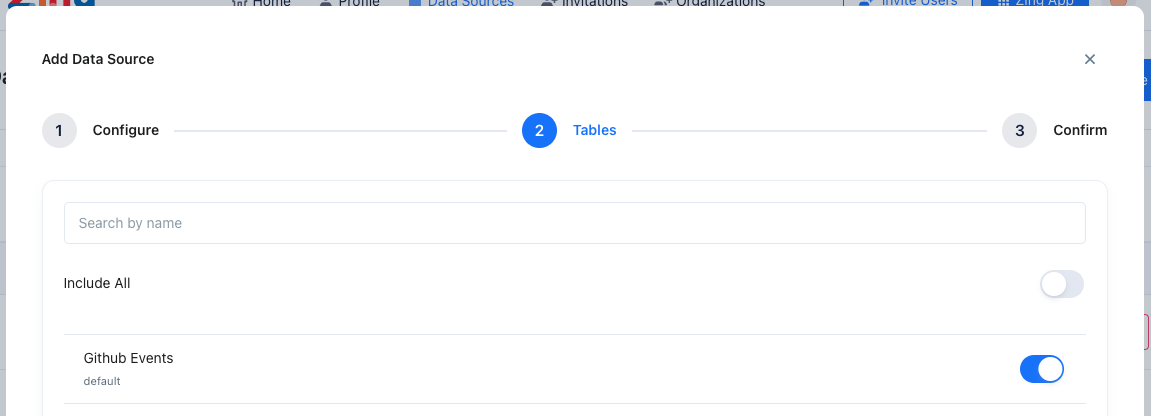
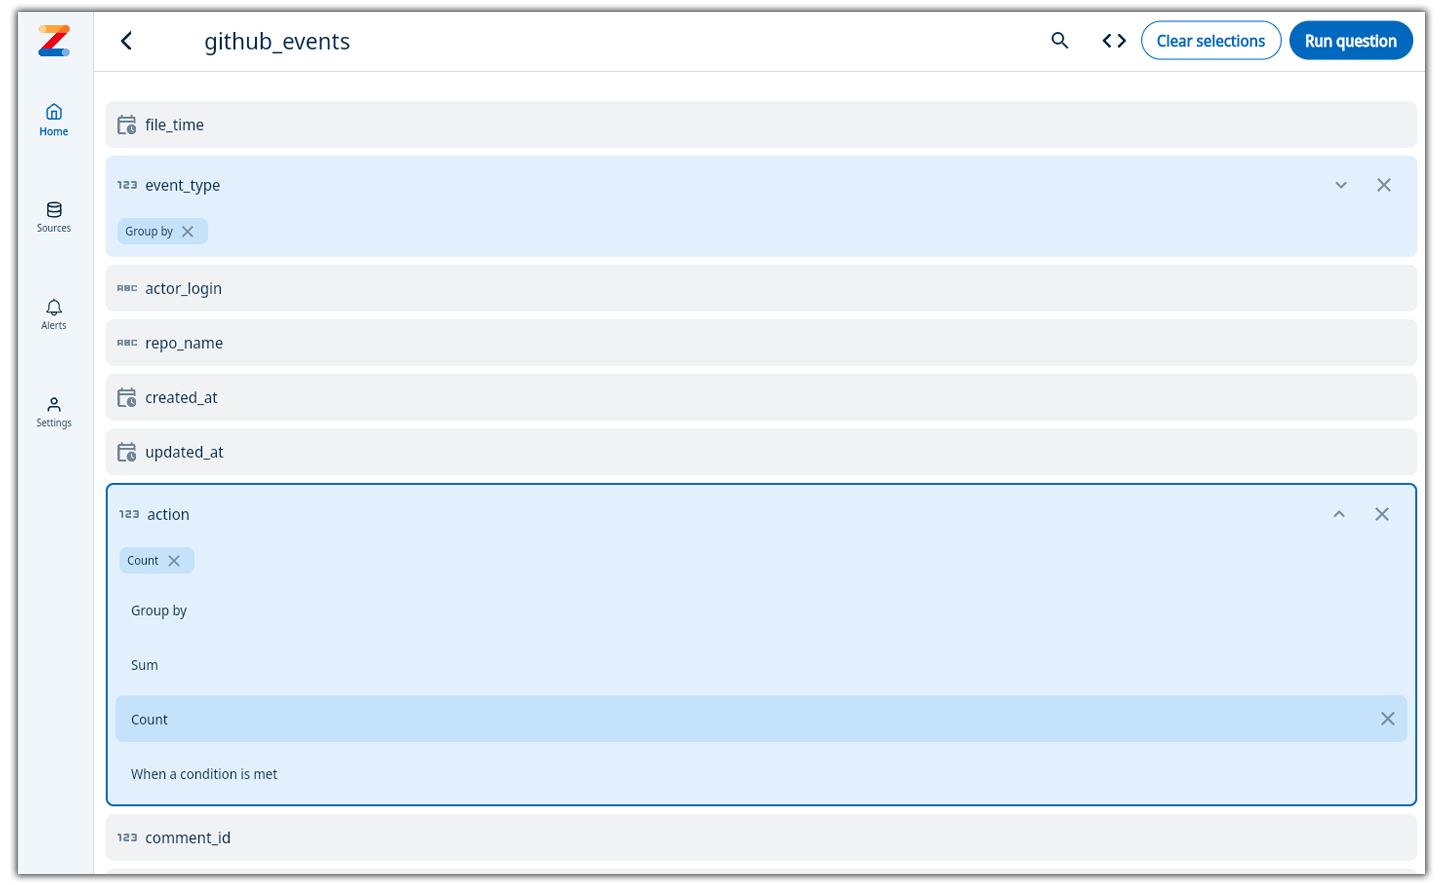
Let’s select the github_events table for us to analyze.
Now click on Zing App on the navigation bar where you can run queries and view questions.
Zing allows creating a question via the visual query builder, custom SQL or natural language. Let’s get started.
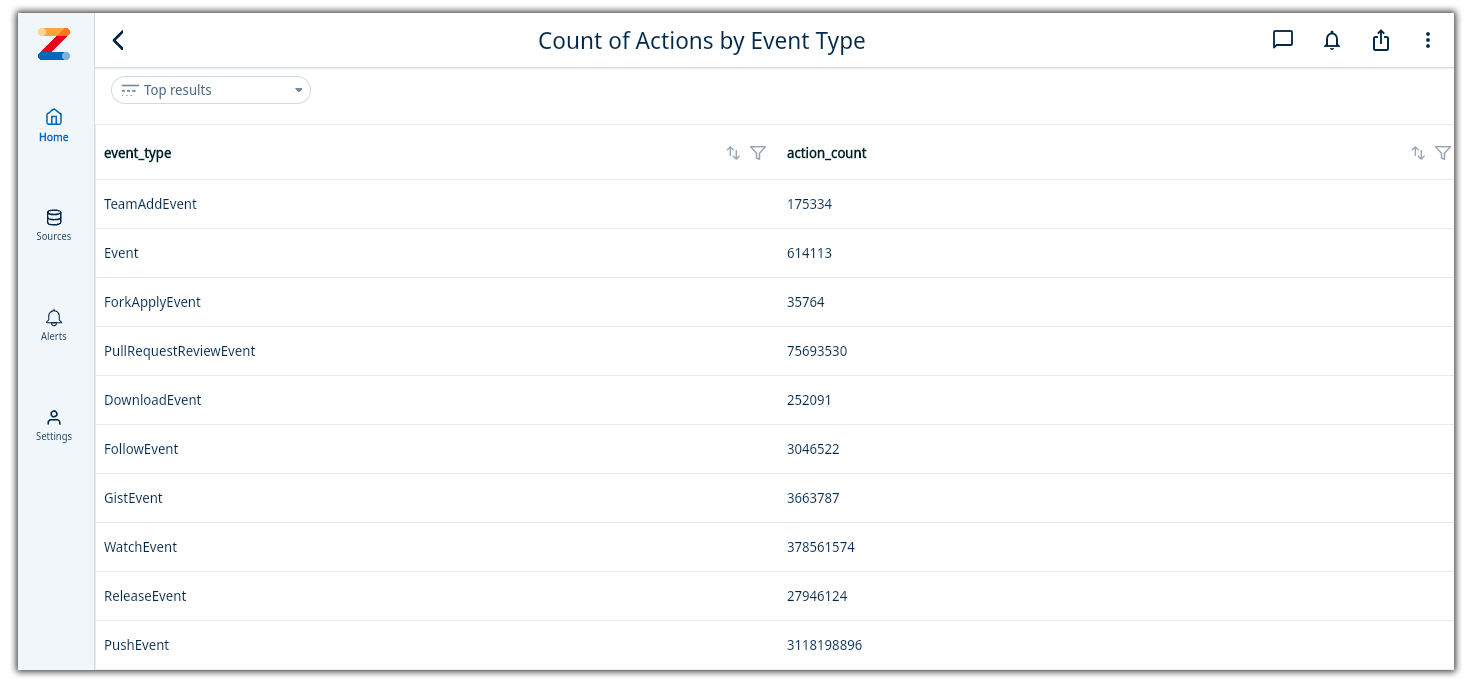
 3. Click on Run Question to view the results. Once the results are displayed, you can save the question by clicking the three-dot menu and clicking “Save Question”.
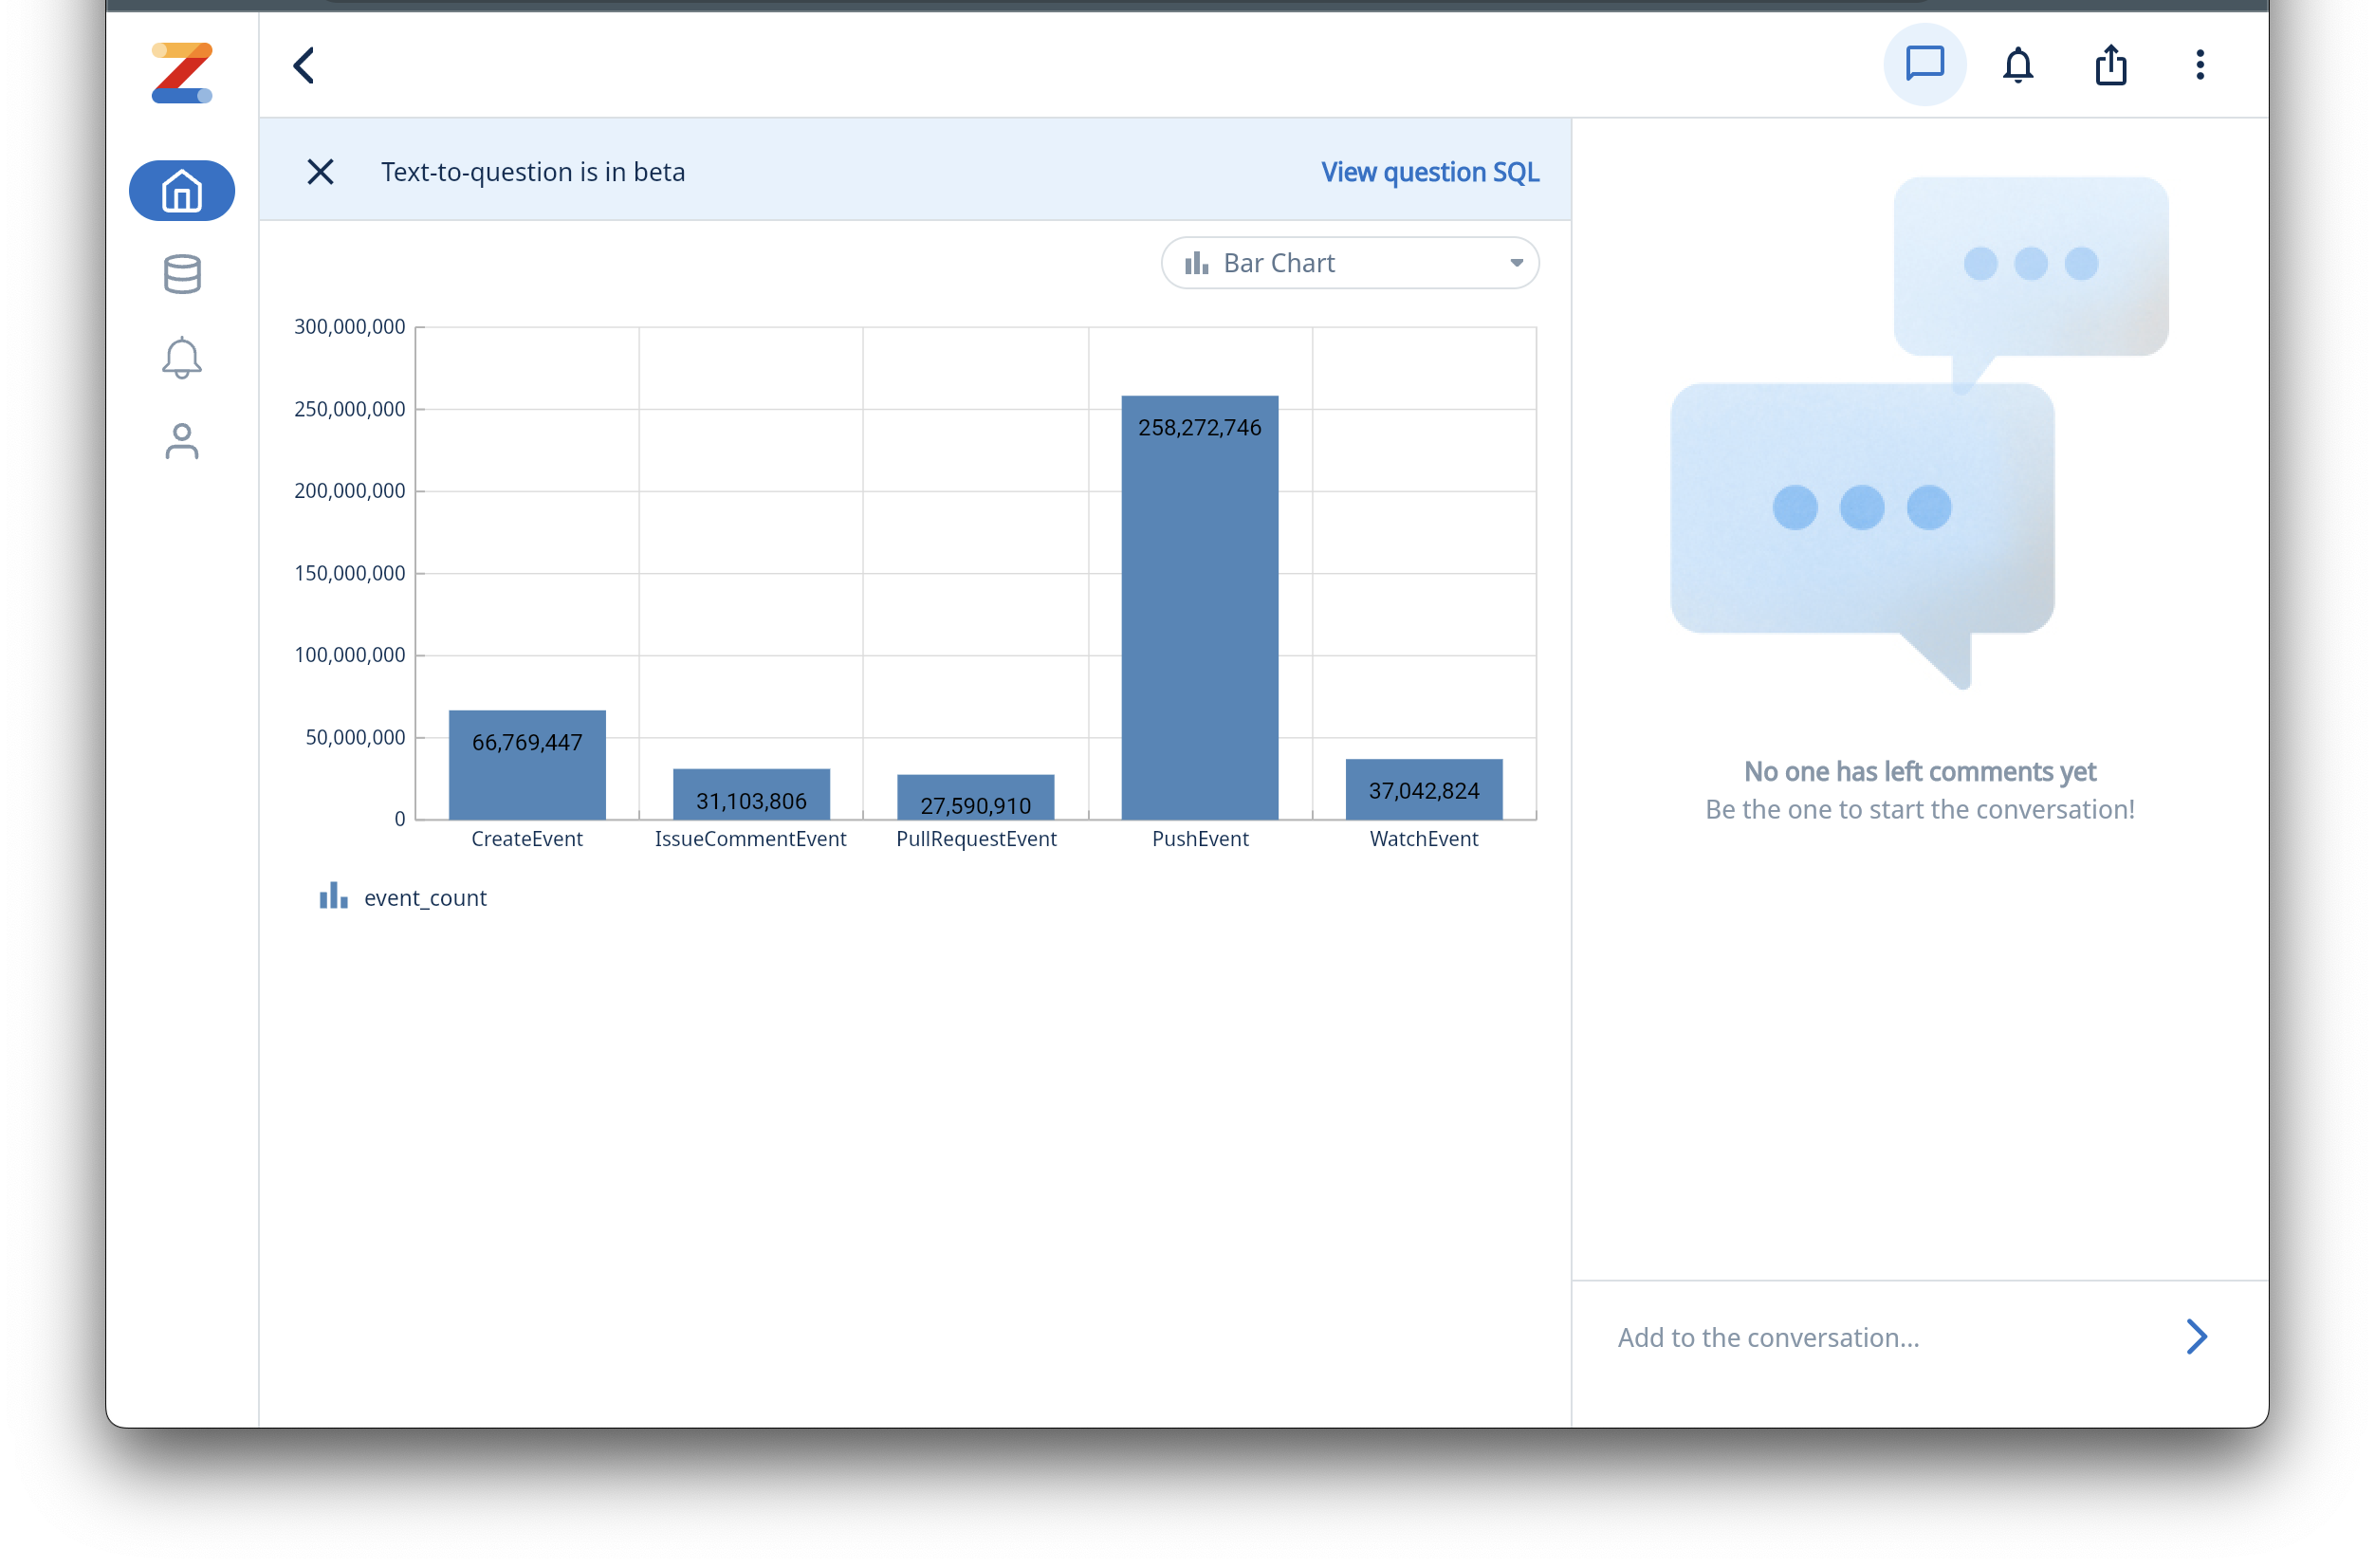
You can also create a question via natural language by typing in your question in the search box on the home page. If you have more than one datasource, Zing Data will prompt you to select a datasource to run this natural language query against. An example natural language would be,
Show me the top 5 events grouped by event_type in the year 2018
Zing Data will infer your query using our AI inference engine assisted by openAI to get you to a data visualization. You can save this question by giving it a name - “Top 5 Github events in 2018”. The underlying SQL can be viewed for this question, by clicking on View question SQL. You can update the question via SQL if required.
That was fast and easy!
Detailed steps of creating the configs can be found here.
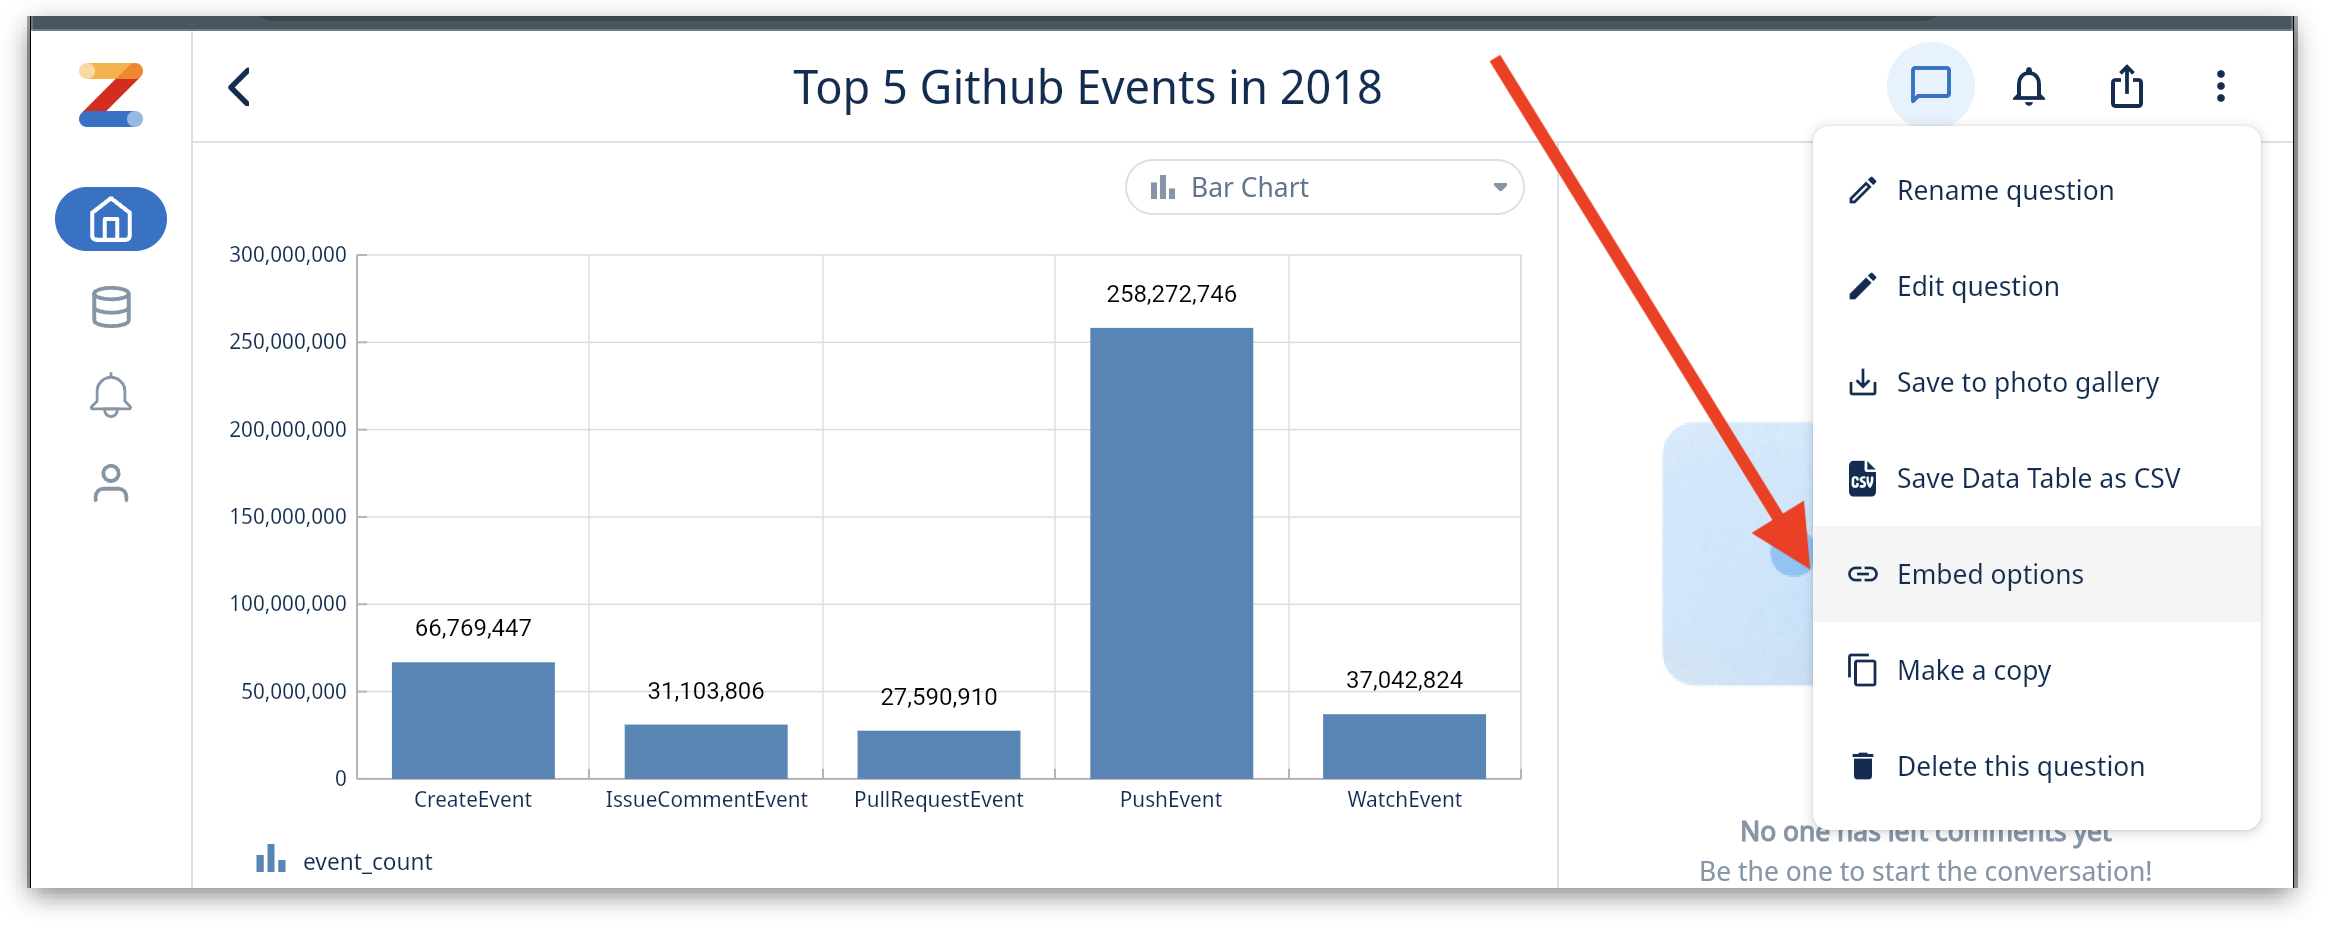
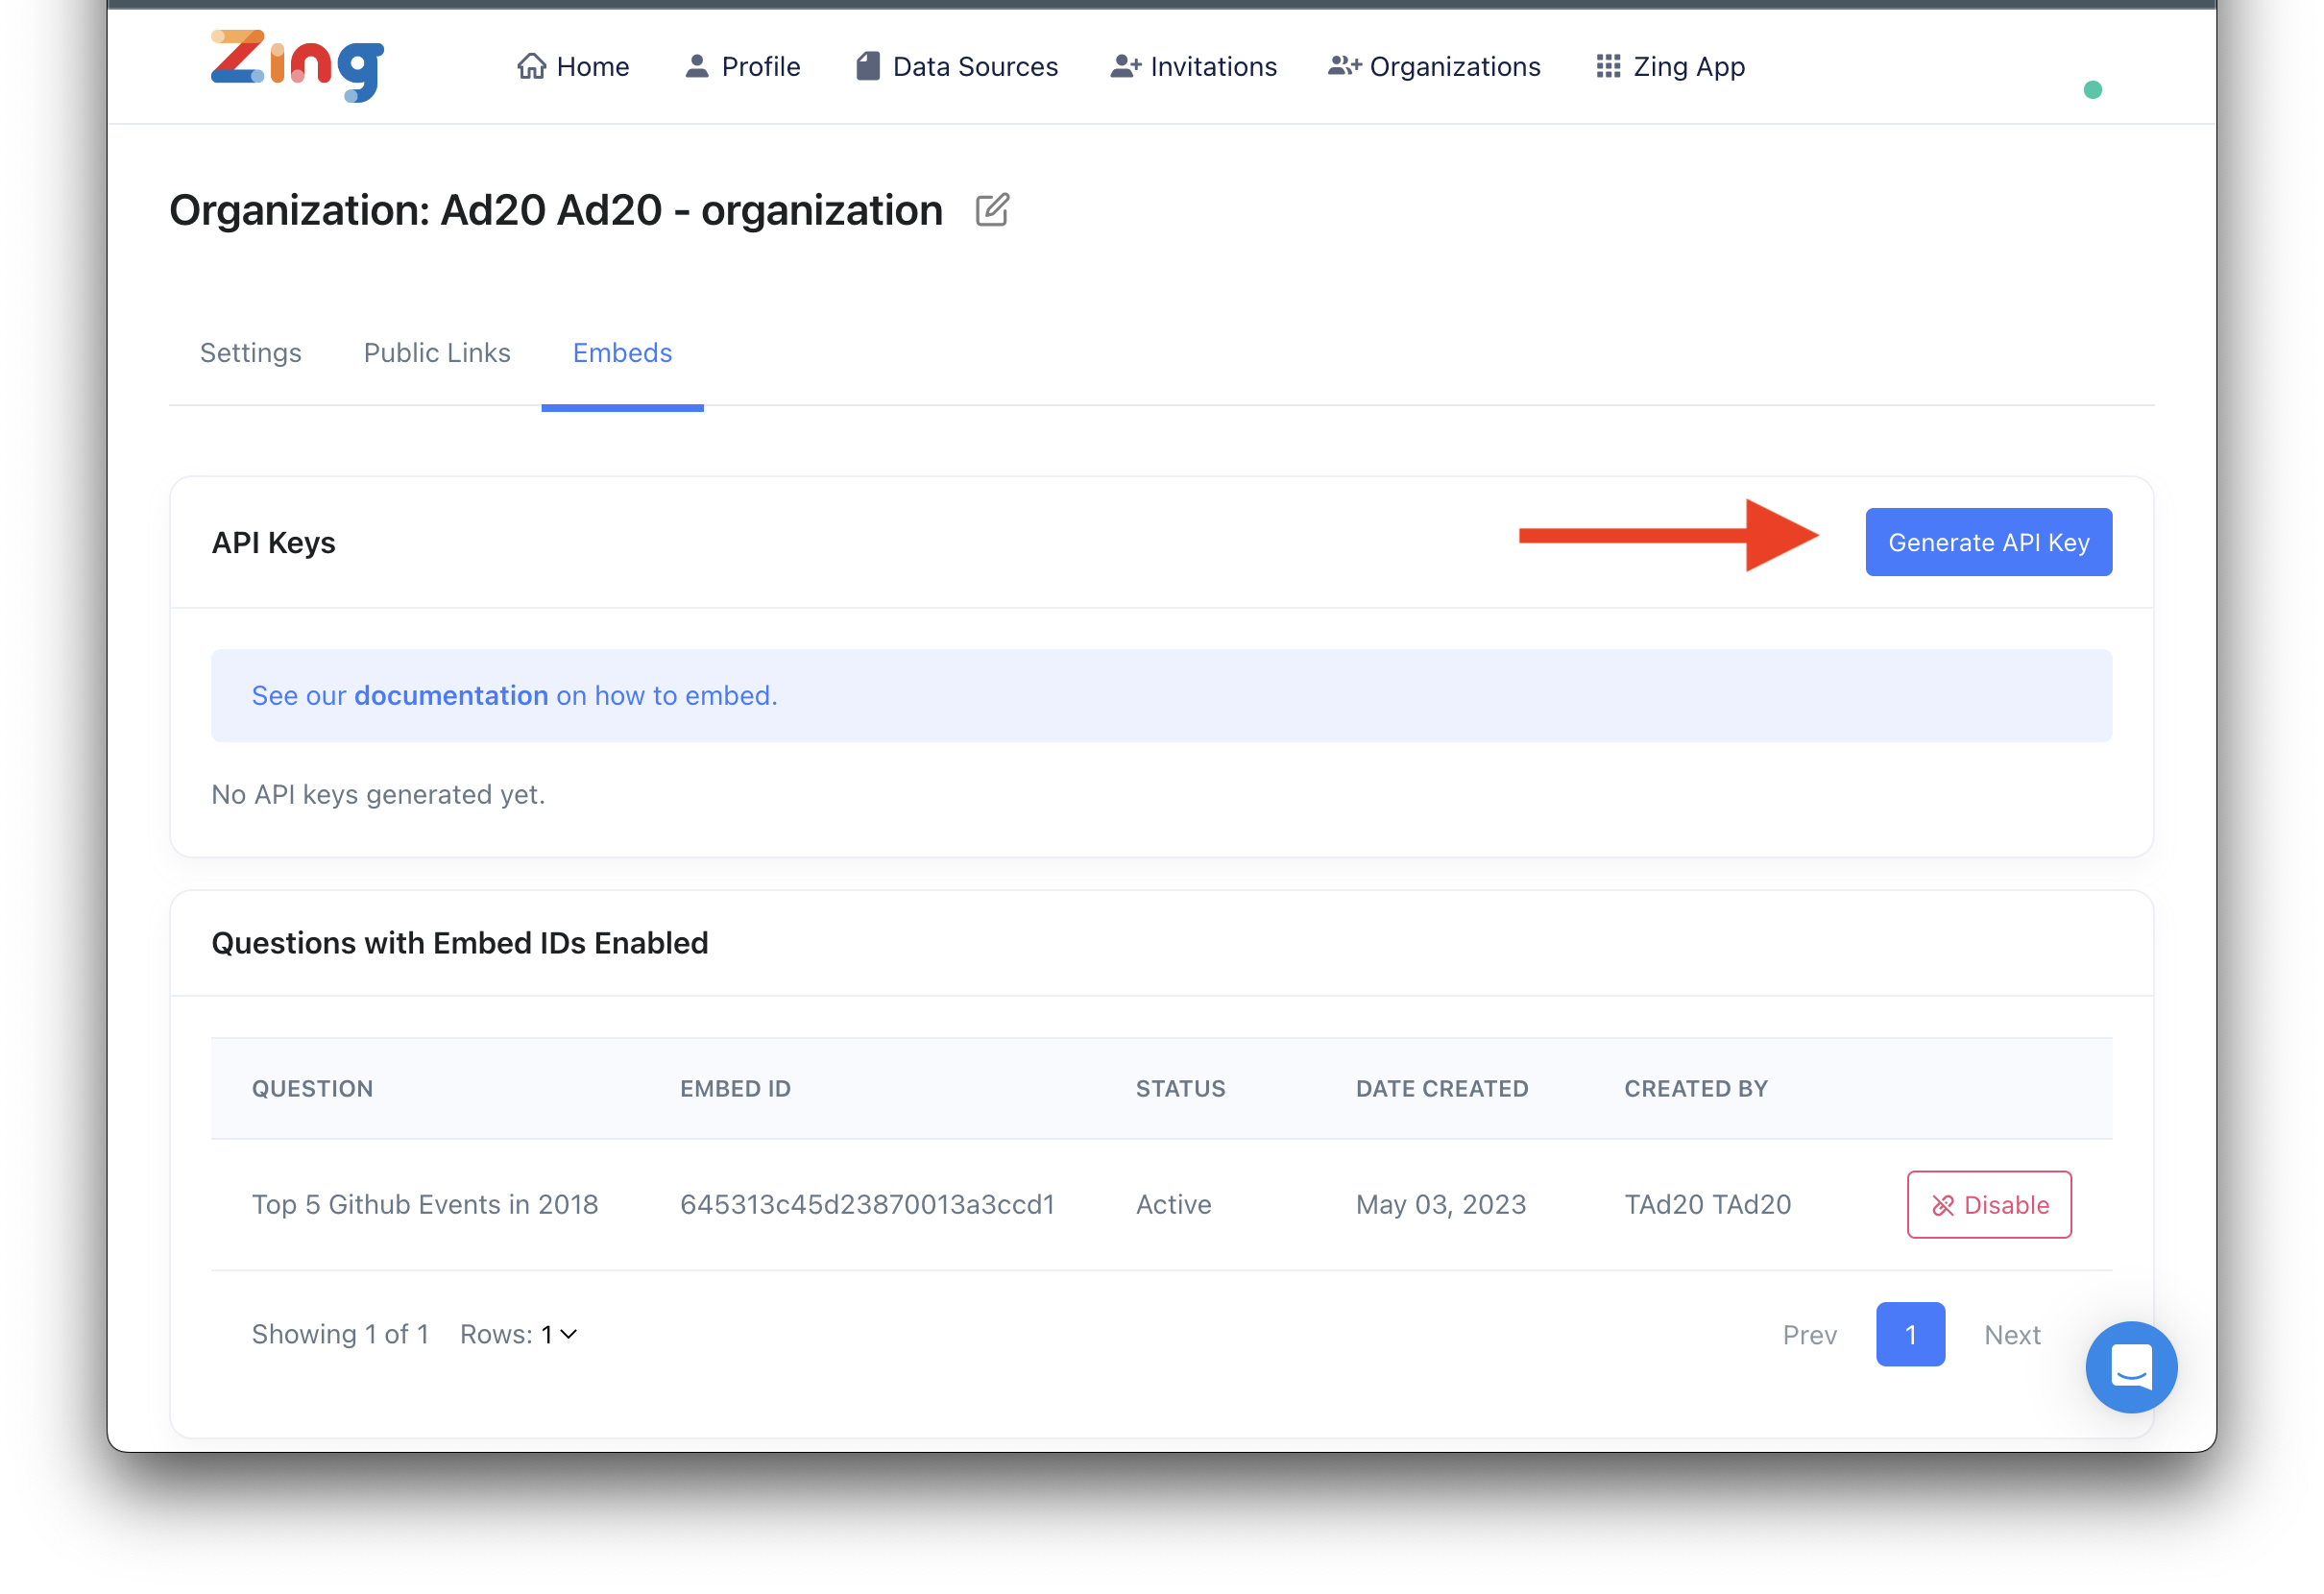
This will give you an embed ID that will be used to reference this question.
As the next step, we should update the frontend and backend code to achieve the following. Detailed steps of integrating the Zing SDK can be found here.
POST https://console.getzingdata.com/api/v1/embed-sessions
npm install @zingdata/zingdata-react
Refer our documentation to view the detailed steps and code snippets for integration.
And that’s it! You have now created an embeddable data visualization using Zing Data’s natural language feature with openAI.
Available on iOS, Android, and the web


Learn how Zing can help you and your organization collaborate with data
Schedule Demo