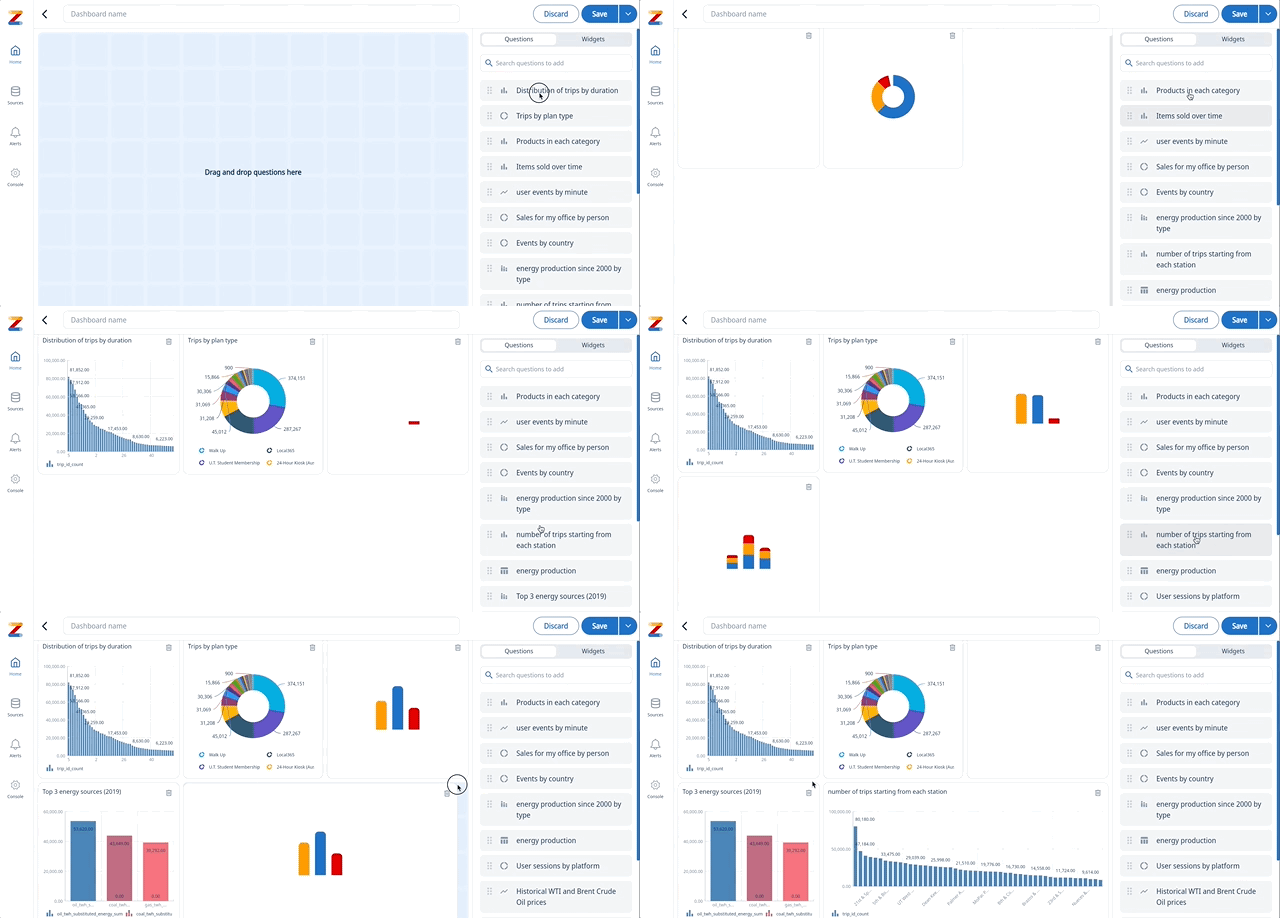
This addition allows you to create visually appealing, interactive dashboards that can be embedded in your applications, websites, and internal tools with minimal code.
With this update, Zing Data’s React / Javascript SDK now supports the creation and embedding of dashboards featuring a variety of chart types:
It previously allowed embedding individual charts, but we’ve made it easy to now embed performant dashboards with just one embed id.
Our intuitive interface allows you to design your dashboard visually. You can arrange multiple charts and analyses visually with our WYSIWYG editor, and take that dashboard to render within your own app.

You have the freedom to embed your dashboards in two ways:
Full Dashboard Embedding: Share your entire dashboard as a cohesive unit, with a single embed id, preserving the layout you created visually within Zing.
This keeps the layout / formatting of your dashboard and the charts / analyses within it without needing to recreate the layout within your app or site.
Individual Chart Embedding: Embed charts individually if you want want individual charts on various screens or tabs of your app and need more specific control over layout.
One of the most powerful features of our chart and dashboard embedding is the ability to pass attributes to make the content dynamic for each viewer.
For example:
user_id to display personalized data for each user and apply that filter to the graphcity attribute to show location-specific informationThis functionality allows you to create a single dashboard that adapts to provide relevant information to different users or contexts.
To optimize performance and minimize database calls, you can now configure the caching duration for your embedded dashboards:
This feature allows you to balance data freshness with system performance, ensuring a smooth experience for your users while maintaining data relevance.
The new dashboard embedding feature opens up numerous possibilities:
User Facing Analytics: Embed dashboards in your website or product to share data with your users or customers, specific to each user’s profile or preferences.
Internal Reporting: Easily share key metrics and KPIs across your organization, with data tailored to each department or team member within your internal applications.
Public analytics / data storytelling: Embed dashboards in your website or product to share data with your users or customers, adapting to each user’s profile or preferences.
Dashboard embedding is now available for the Pro plan and above.If you’re already a Pro plan user, you can start using this feature immediately. You can also access this embed capability if you’re on a trail period of a paid plan.
To begin creating and embedding your dashboards:
For detailed instructions, please refer to our documentation
Download Zing Embedded Analytics Overview PDF
Available on iOS, Android, and the web
Learn how Zing can help you and your organization collaborate with data
Schedule Demo