As a realtor, your business foundation is in the relationships you’ve built with everyone around you. You know that to build strong relationships, you start by getting close to the people around you, but how can you do that better, when buyers want to ‘see the data themselves’ and want quick answers to often data-focused questions around sales and comparables to inform their decision.
Clients demand concrete data, statistical insights, trends, and an easy way to understand all of that.

Exceed clients expectations, by leveraging the power of data and visualizations to make more compelling sales pitches.Understanding your customers’ wants and presenting them on a customized dashboard with supporting data can go a long way in explaining to customers, helping you sell more properties.
To create visualizations like these:
You either have to:
With Zing Data: everything changes. Zing is designed to simplify data analysis for busy professionals like yourself, who are always on the go.
Connect to your data, create informative visualizations, export them as images to be used in your deck or share them with your team members, right on your phone. Here is a walkthrough of how Zing Data will change your data analysis workflow as a realtor.
The most time-efficient way you can work with data is by connecting to a database, such as the one containing MLS data your firm uses. This is a one-time process, once you’re connected, you can always work with the most updated data provided by your MLS without further configuration.
Zing works with a variety of popular SQL-based databases: PostgreSQL, MySQL, Microsoft SQL Server, Snowflake and more.
Not sure which database your firm is using and/or how to connect to it? No problem, we can help you set it up!
Alternatively, you can find and download publicly available housing market datasets online, before uploading them on to Zing as .csv or.xls files, or on to Google Sheets. These datasets usually contain aggregated information of geographic areas by zip codes, cities, states, or countries arranged in monthly or yearly intervals. Such data can help you and your clients identify trends in your area’s housing market and discover opportunities.
Examples of sites where you can find free data are:
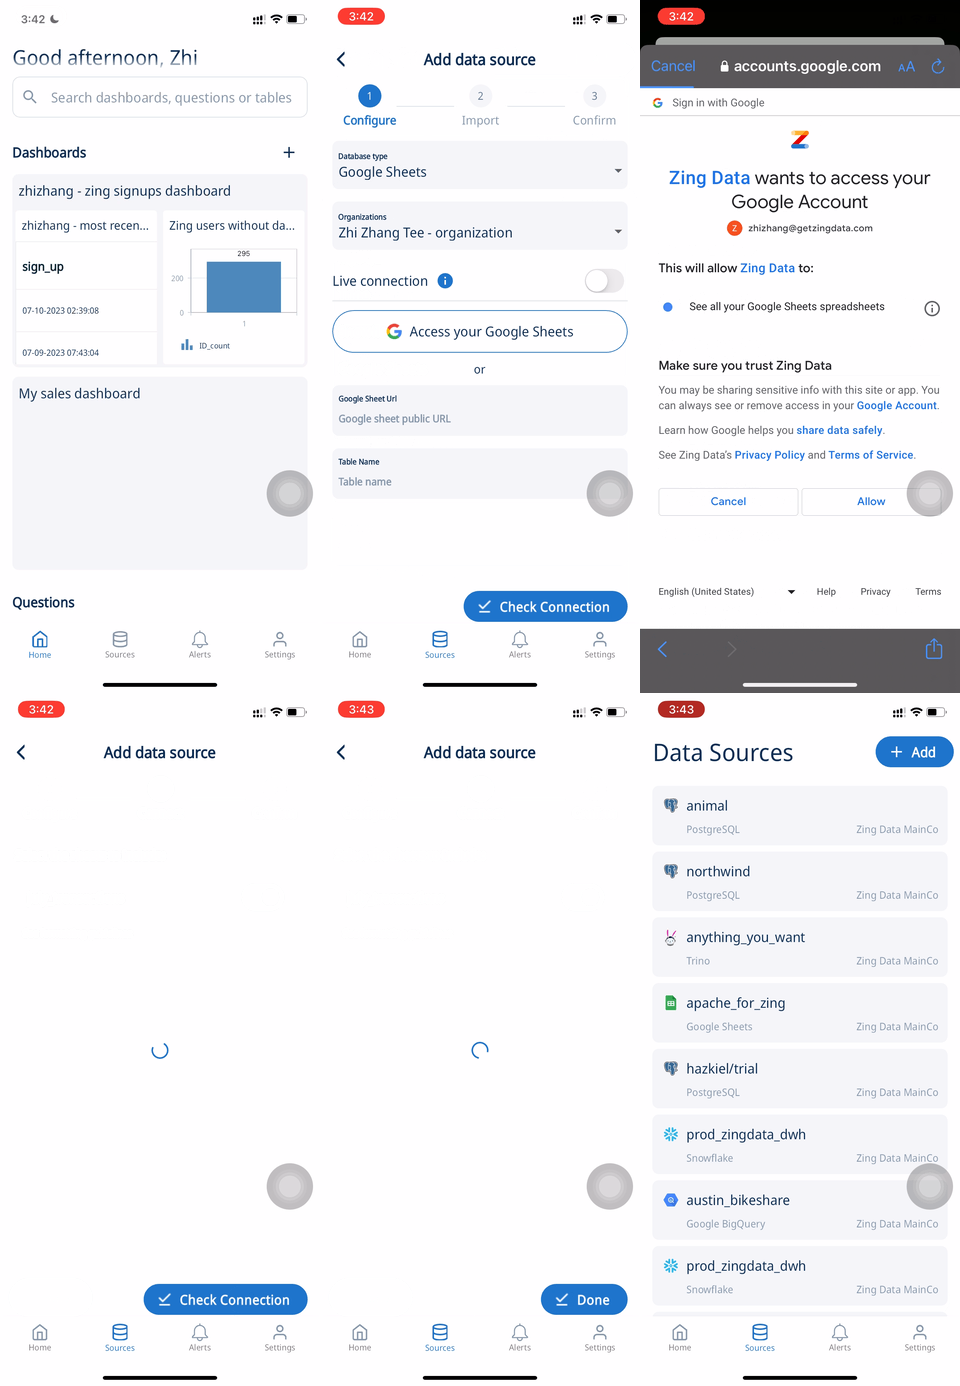
Here’s how you can upload the datasets you’ve downloaded on to Zing!
With an Excel/CSV file: 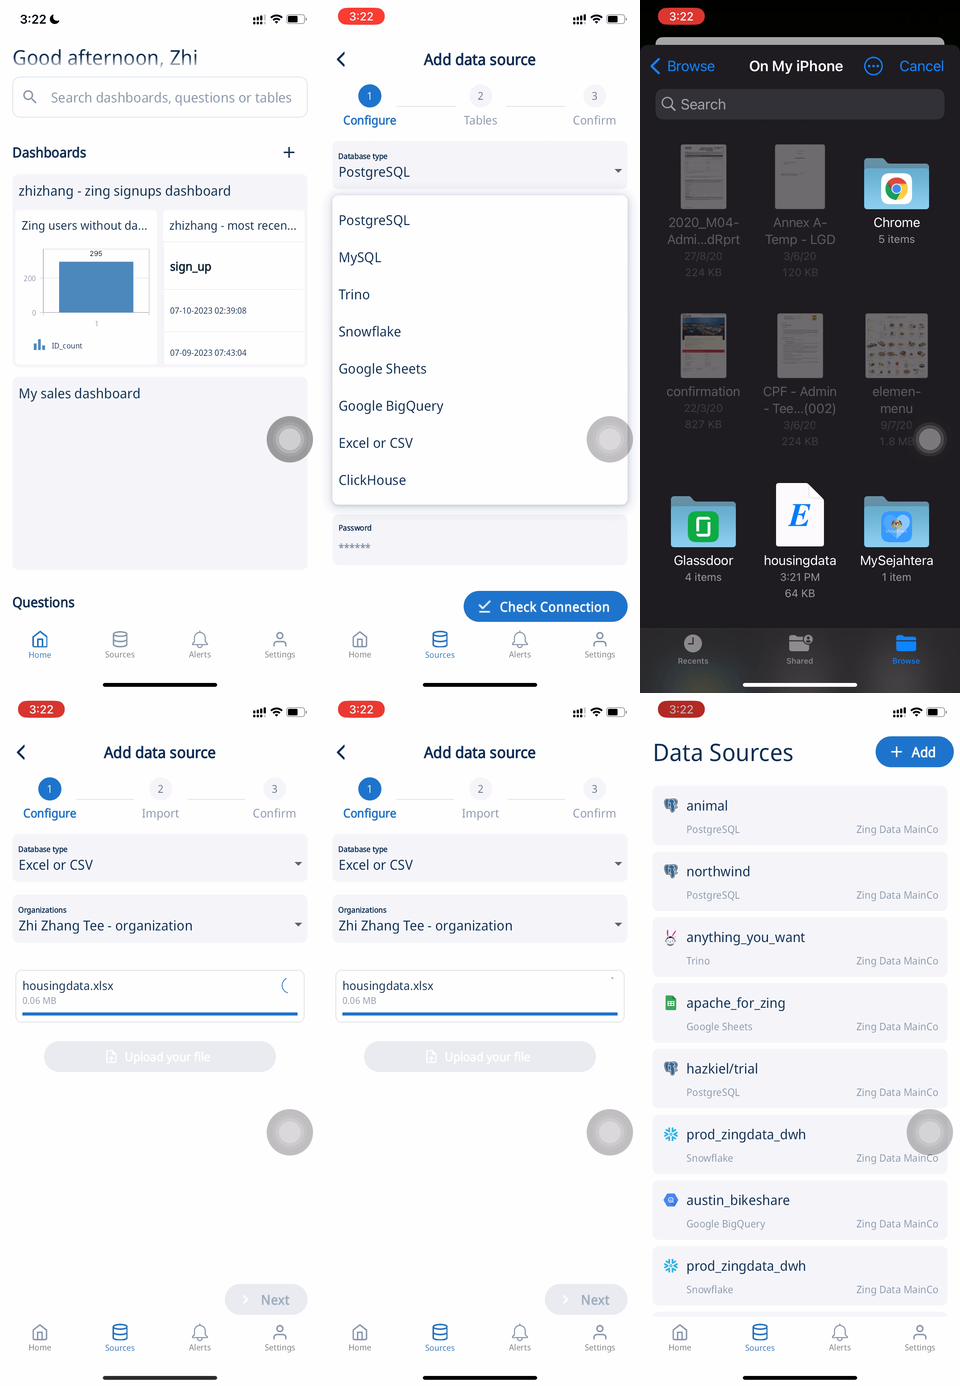
With Google Sheets:
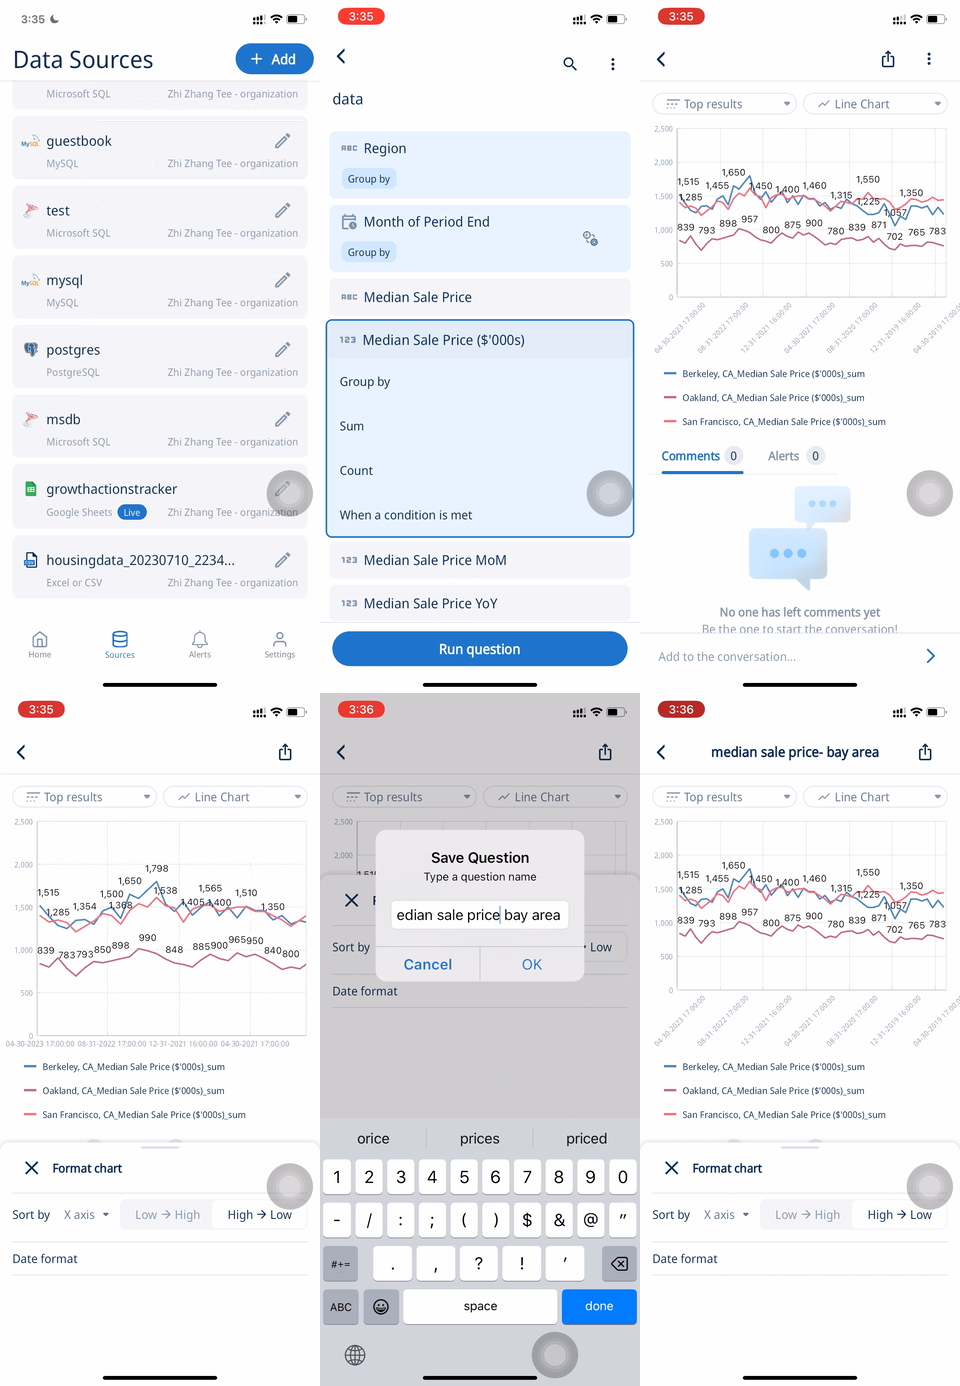
With Zing’s newest SwiftQuery feature, you can simply drag and drop fields into a chart template, and see the visualizations come to live! You can also define filters for the data returned, and introduce dimensions to the output.
In this example, I am using data about the housing markets in San Francisco, Oakland and Berkeley from RedFin, and want to educate my clients on trends in the North Bay before they move here:
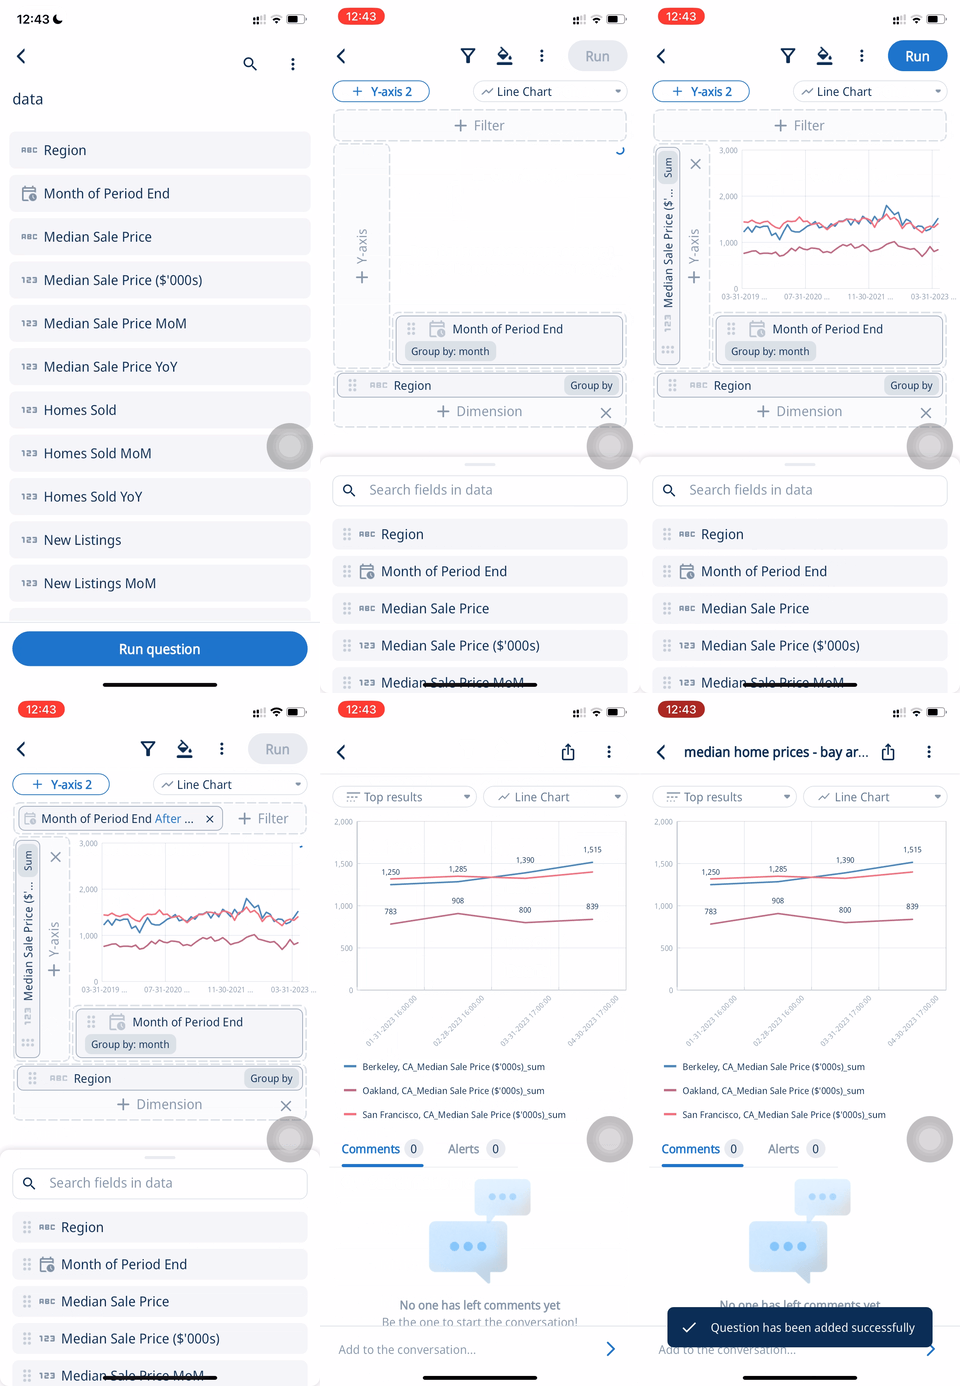
You can also click to select your own aggregations on data fields to use:
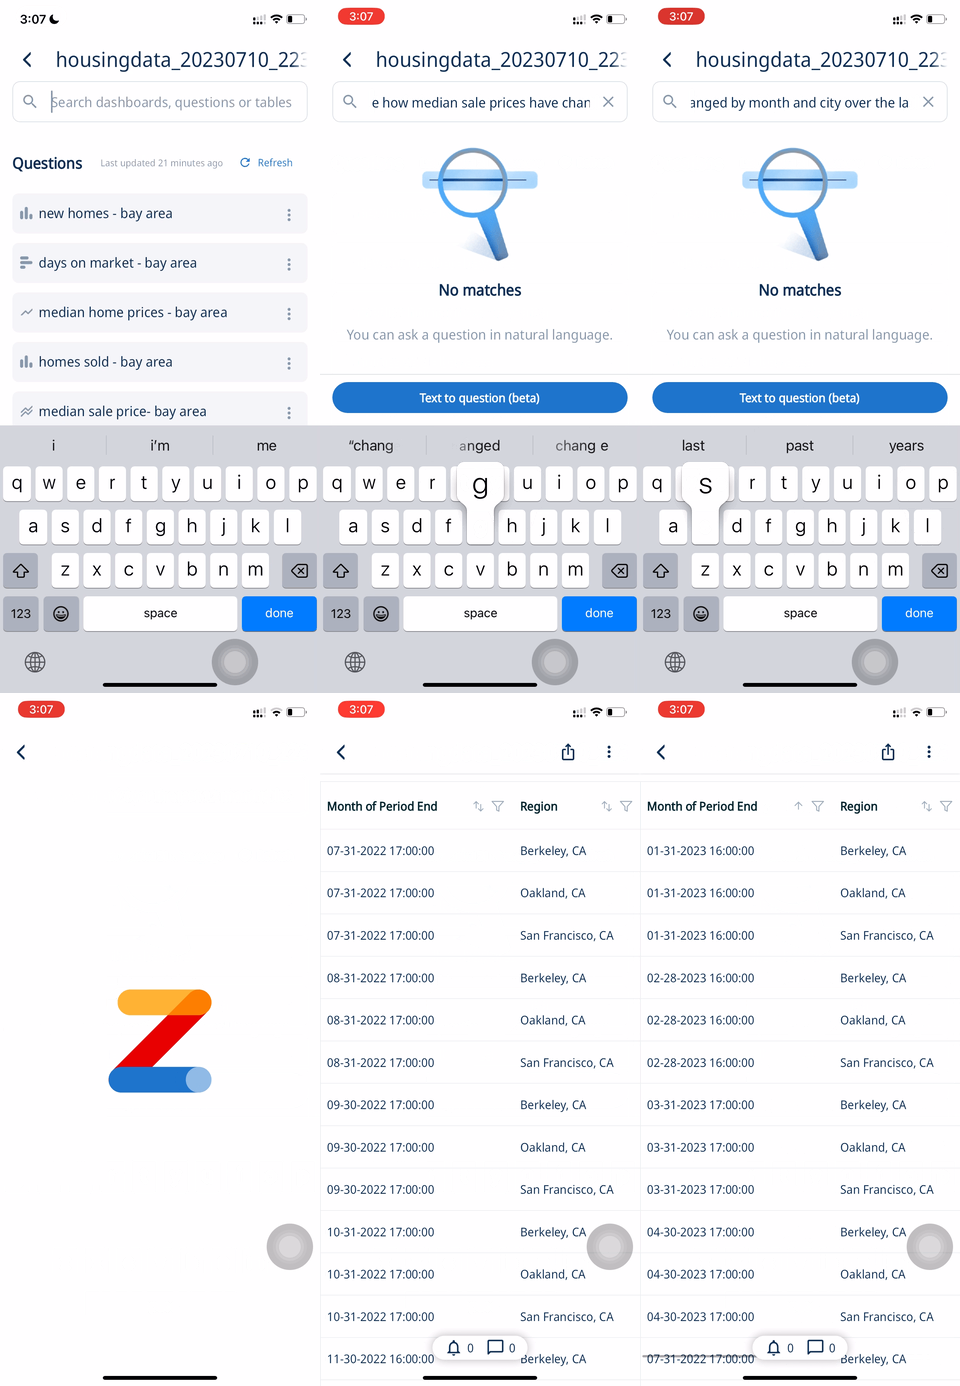
An even simpler way of creating visualizations is by asking what you want, in prose! Zing translates your words into SQL code, using LLMs from OpenAI, Google and more, you just need to ask away in our search bar:
If you want to write your own SQL commands and conduct more advanced data manipulation before visualization, you can do so with Zing’s Custom SQL Editor, equipped with code typeahead and color coding.
What can you do with the visualizations you’ve just created?
Working with data need not be boring! Share the interactive visuals created with your clients and let them get what they want, by sorting, and filtering through output data.
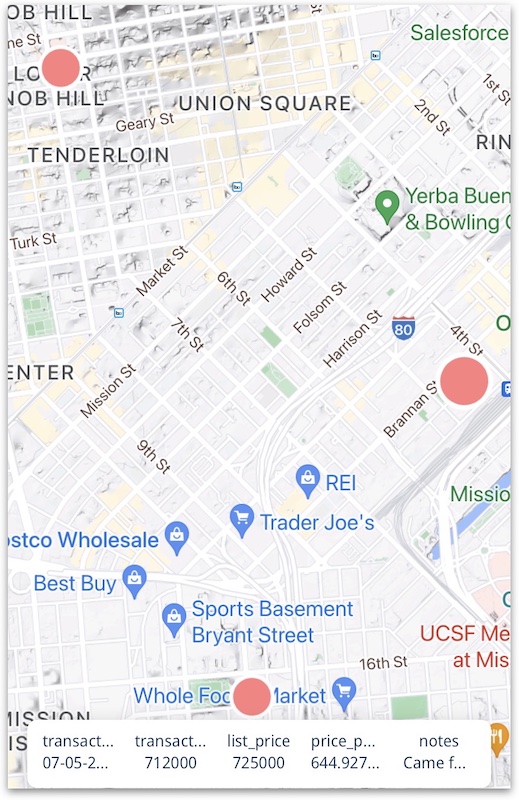
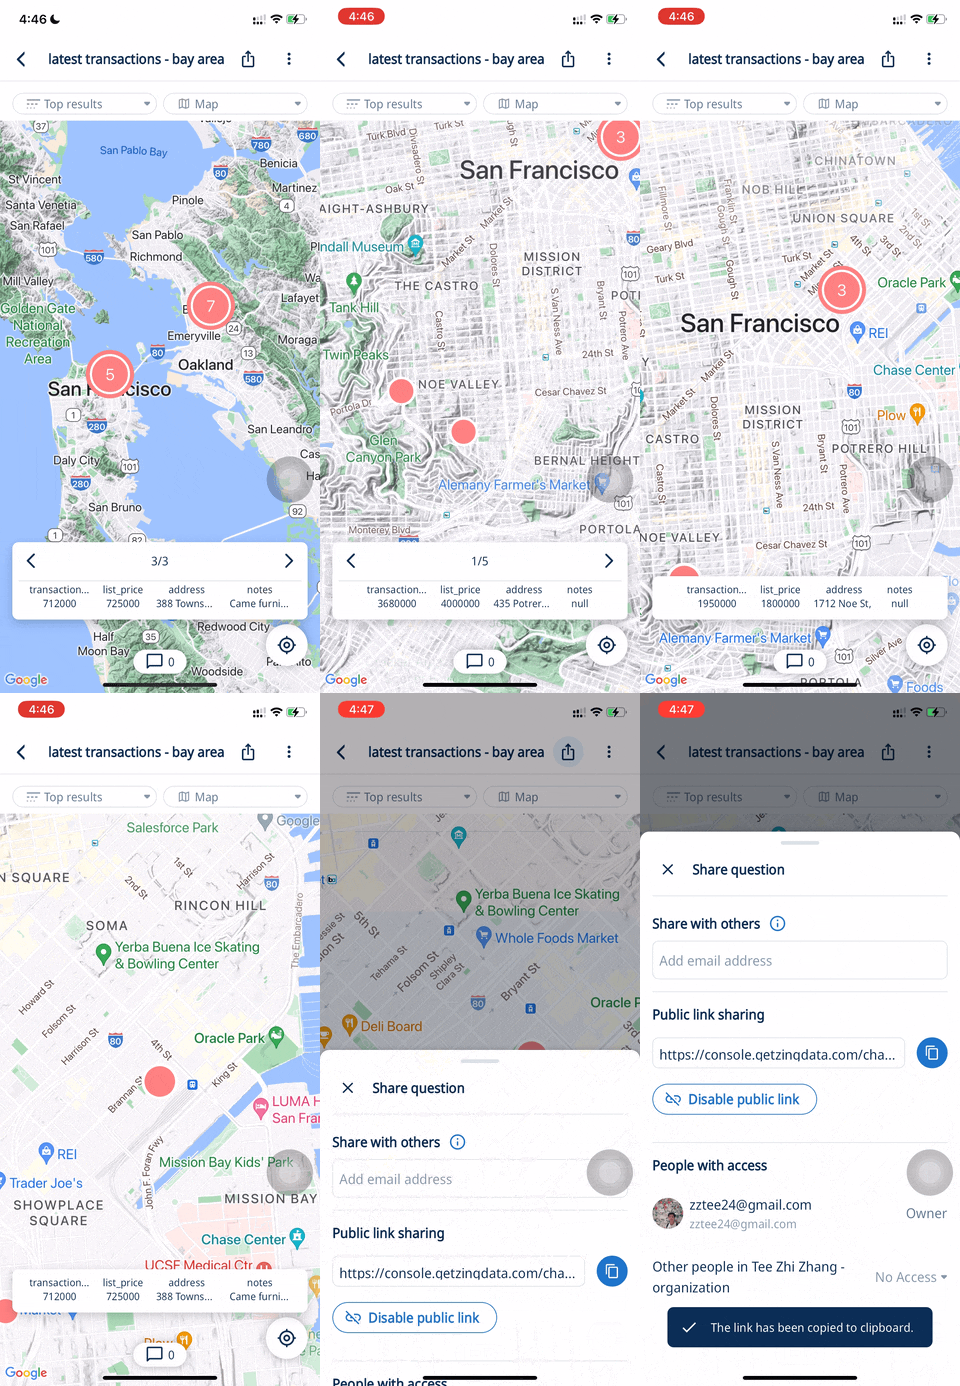
Here is an example of how you can present information about recent listings or transactions on a map:
Clients can make edits to the types of data they want to focus on: 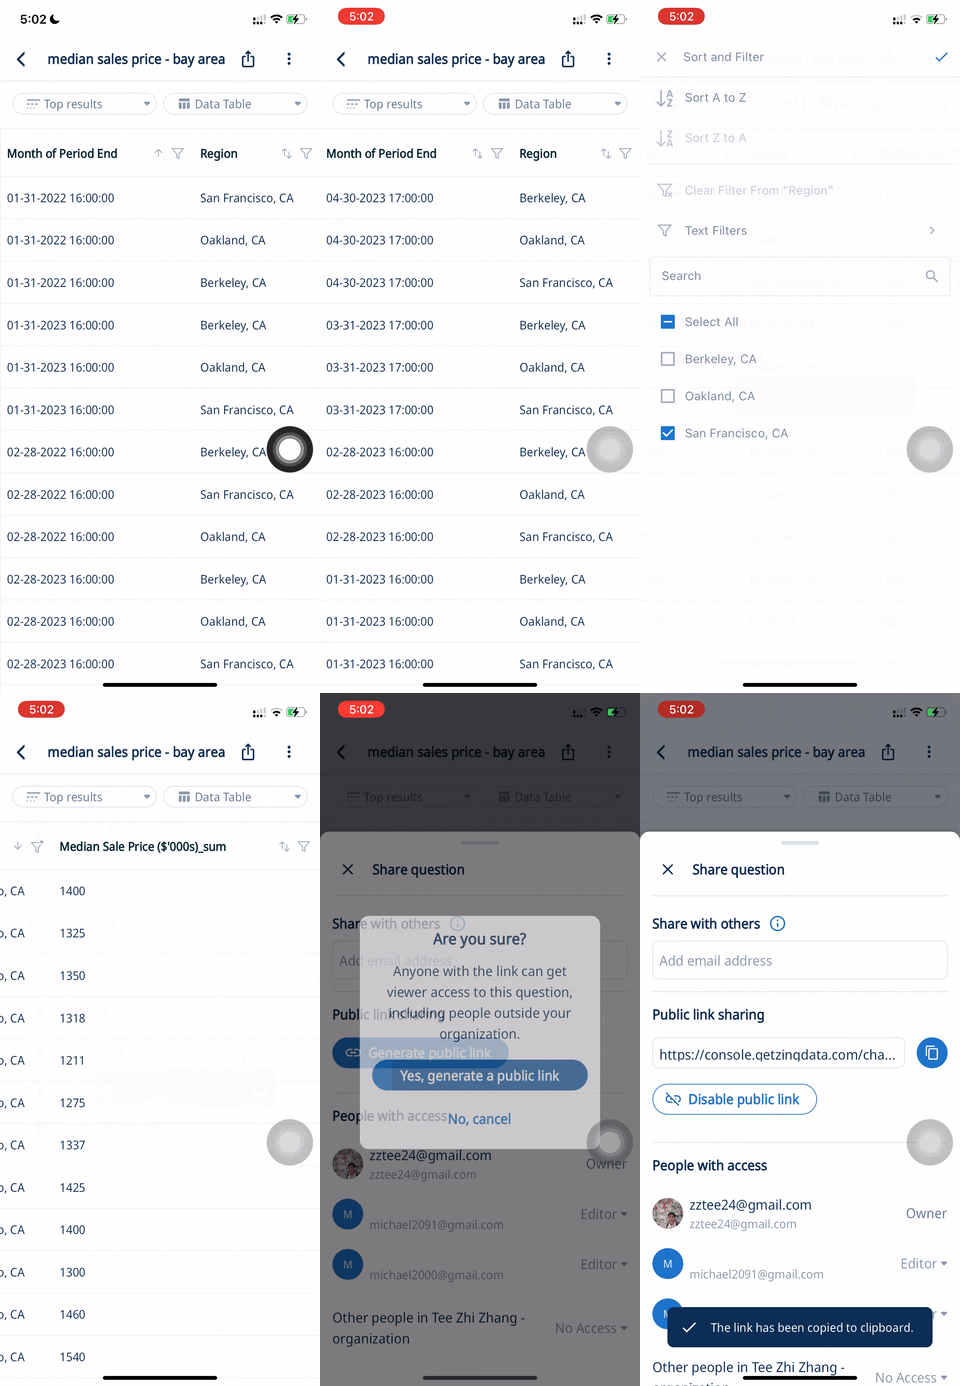
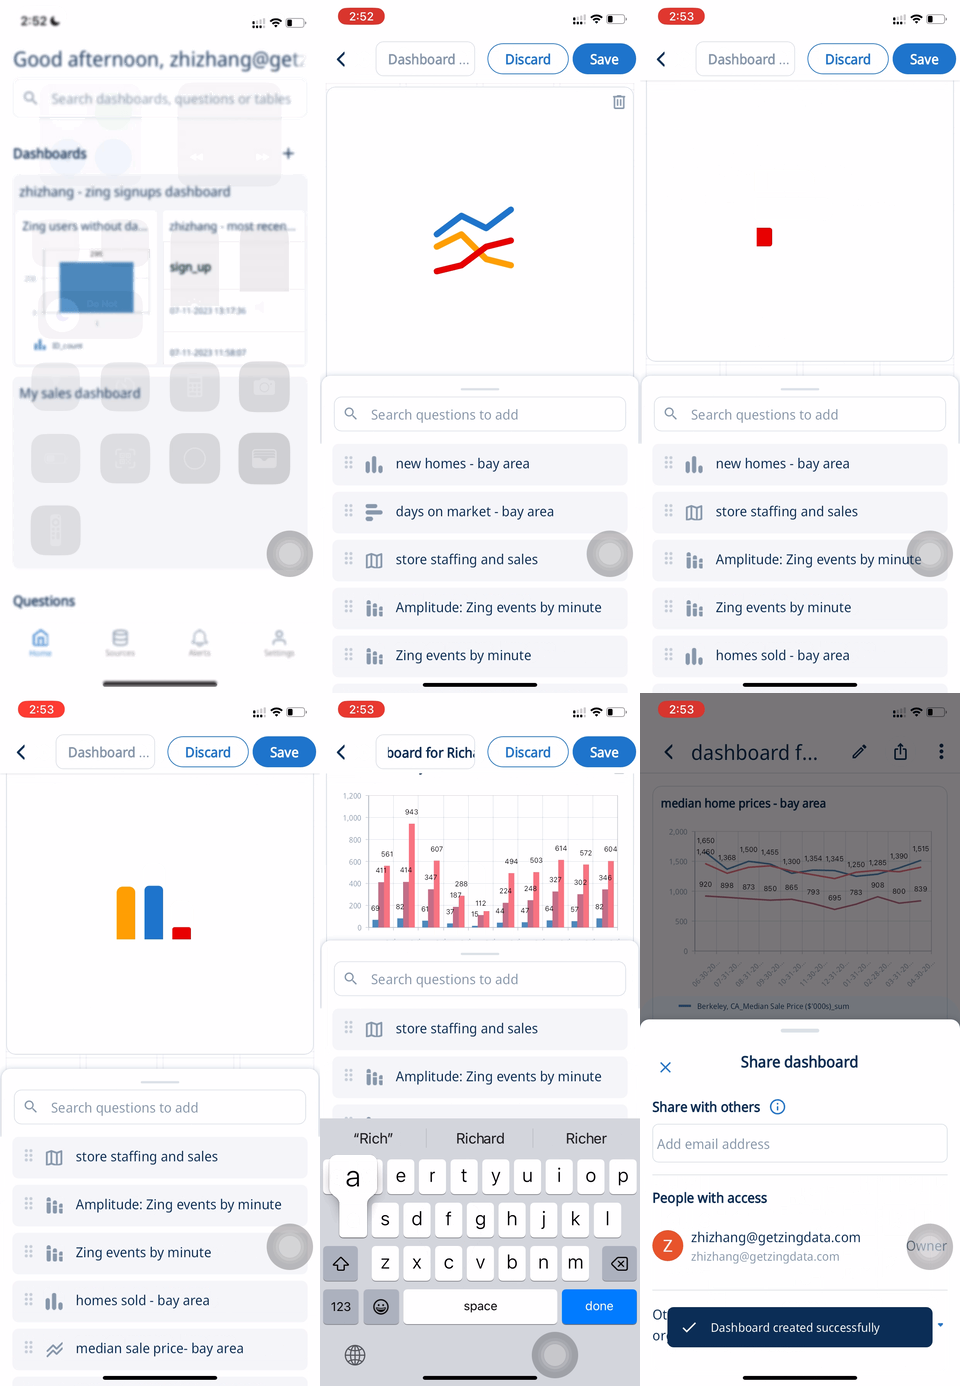
Create dashboards containing specific visualizations for each client, and easily share via a link. Make your customers feel valued with personalized notes and figures pertaining to their concerns and demands.
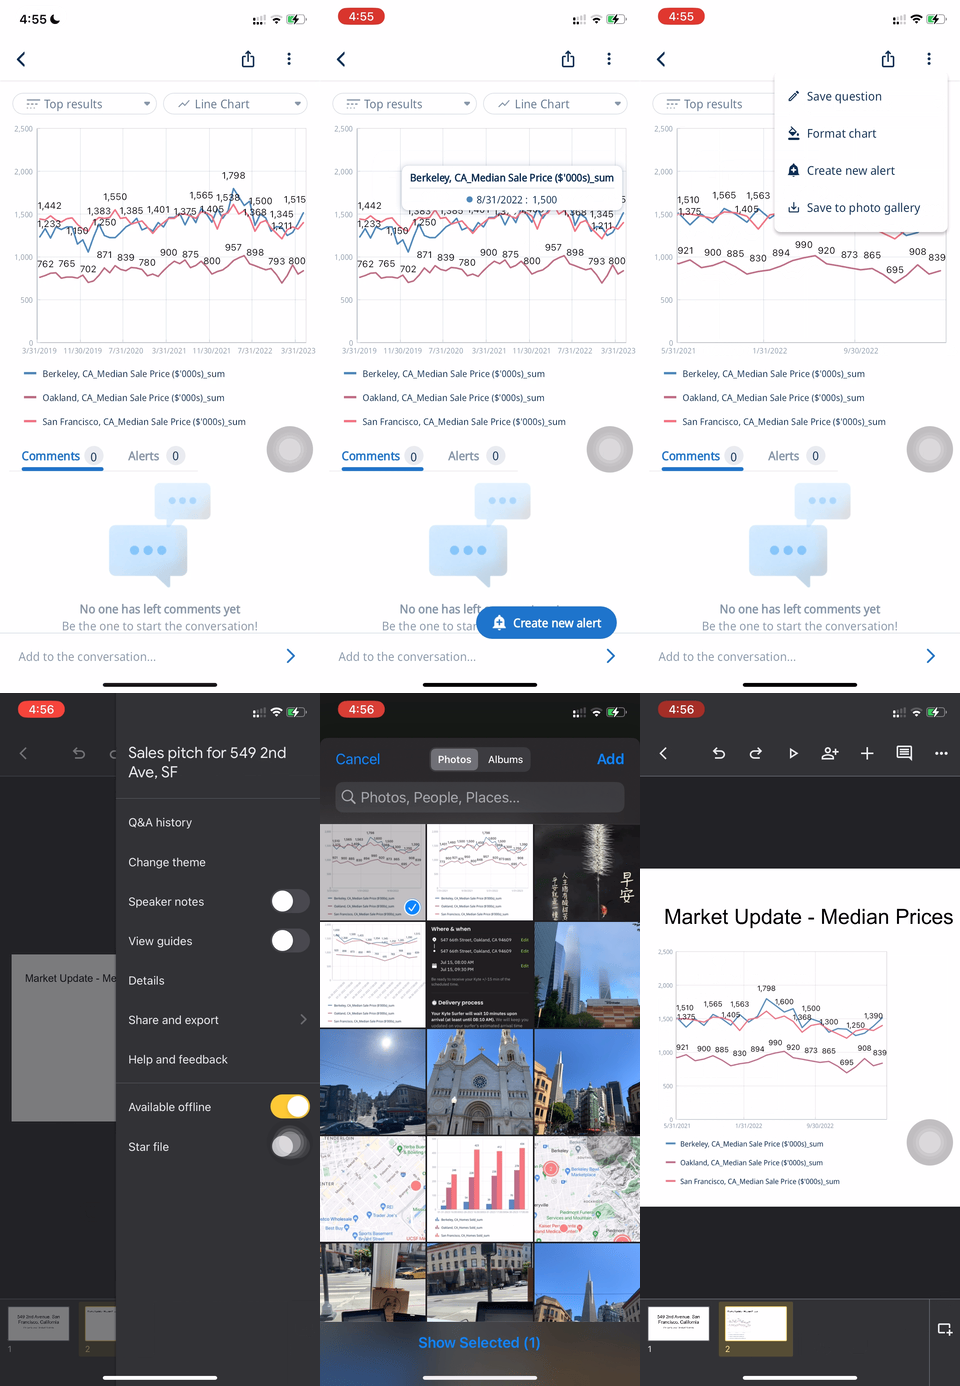
Easily export charts and graphs as images to be pasted into your slide deck or document! Boost credibility for your pitch in just a few minutes, wherever you are.
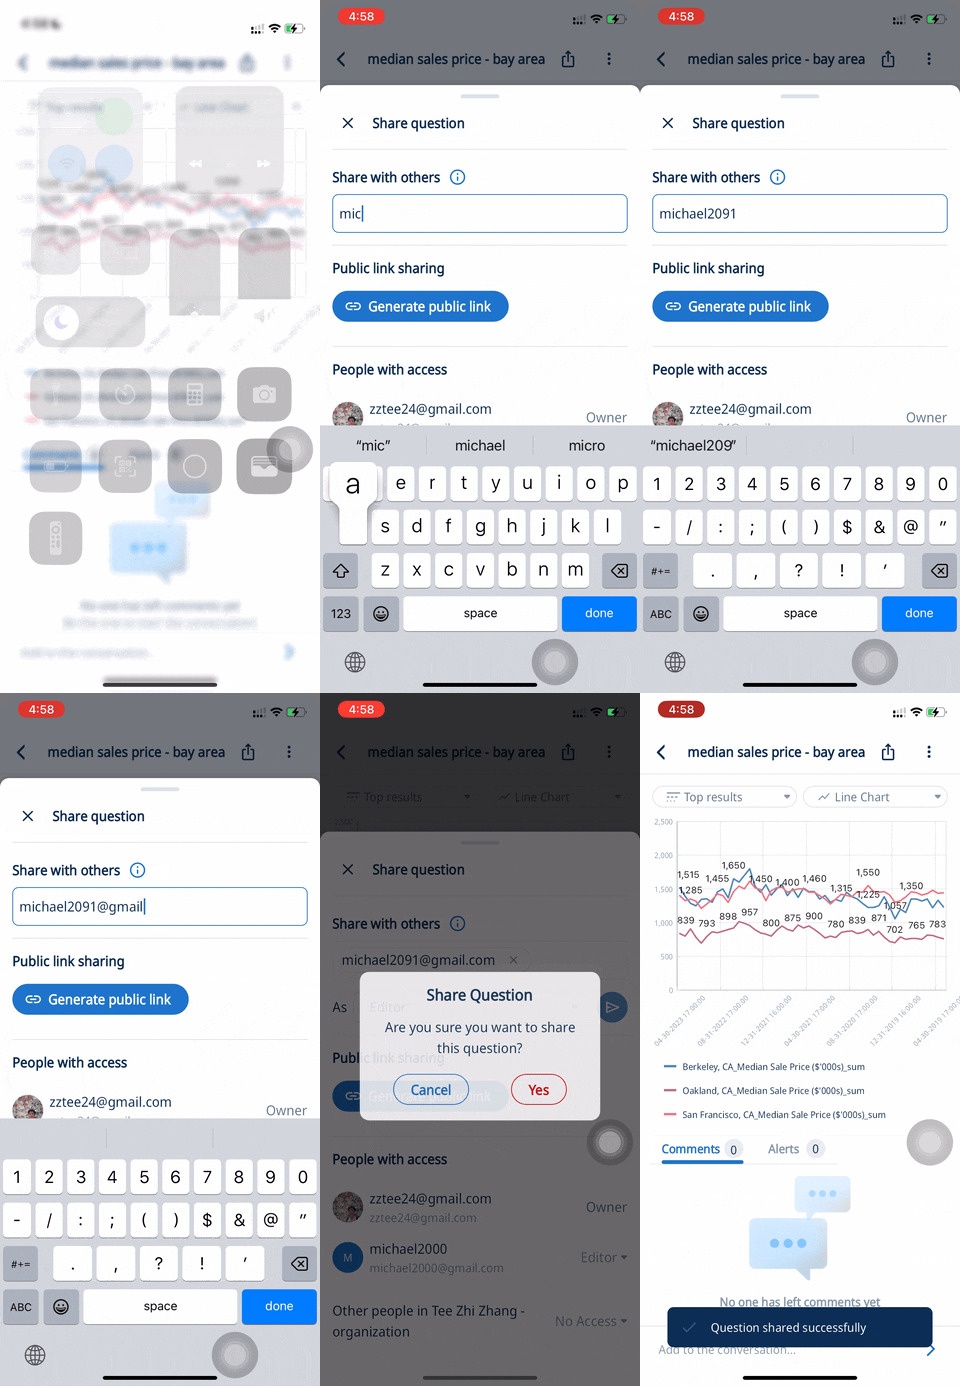
Zing is designed to be collaborative, so if you’d like, you can share the work you’ve done with fellow agents at your firm and pool together resources so that everyone can improve their game.
In today’s competitive real estate market, where buyers and sellers are presented with countless options, it especially crucial for agents to adopt innovative approaches that captivate potential clients.
We have shown you how you can harness the potential of data and visualizations to redefine your sales strategies, build trust, and effectively communicate the value of properties to your leads. Take the next step with Zing, and use data as your competitive advantage.
Available on iOS, Android, and the web
Learn how Zing can help you and your organization collaborate with data
Schedule Demo