🗣️📊 SwiftQuery AI now lets you ask questions with natural language, or easily drag + drop →

New Feature: Live dashboards

You can now arrange multiple questions into a live dashboard with Zing Data!

Dashboard previews are shown on your home feed, alongside questions and tables. Seamlessly search across saved dashboards, questions, and tables using the search bar at the top.

It all starts with a question

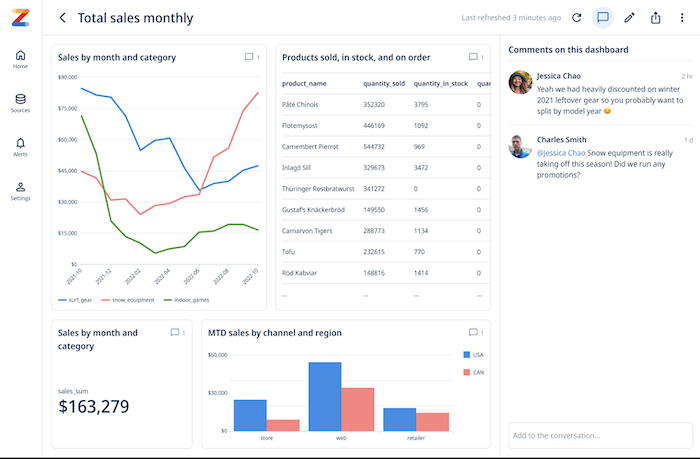
When you open a dashboard, Zing will query your data source(s) live, so that dashboards are always populated with the most up-to-date data.

A dashboard canvas is 12 squares by 12 squares and a question card can be sized as small as 3x3 or as large as 12x12. So a dashboard can up to 16 question cards (12x12=144 / (3x3=9).

Smart layouts that work across any device

Questions cards within a dashboard intelligently re-flow depending if you’re accessing the dashboard on web or mobile and the available screen space. No need to build different versions for mobile and web – a single dashboard design fluidly scales across device types:

  • On mobile, a maximum of question cards will shown side by side so they are large enough to be easily readable. If the dashboard was designed with more than two question cards, the question cards flow vertically for easy scrolling.
  • On web, up to four question cards will be shown side by side.

A dash that is never bored

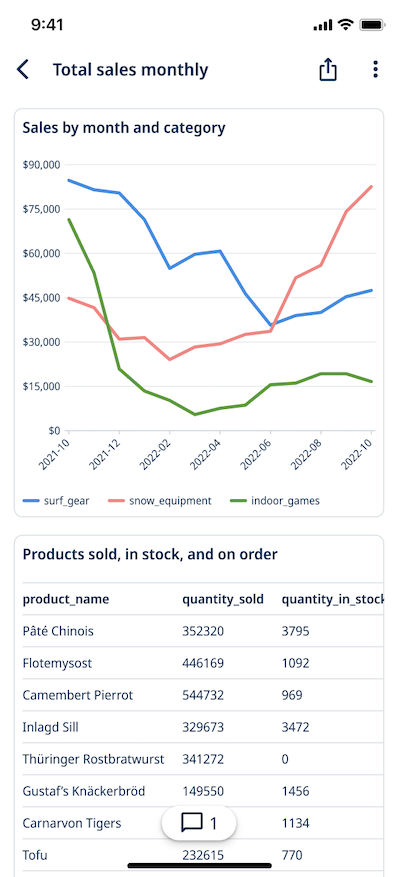
Dashboards aren’t just a collection of questions – they’re live and interactive. Just tap on a question card to see that question full-screen and see comments and alerts associated with it.

From the question, you can also do the following on iOS, Android, and the web:

  • Zoom in / out
  • Change the chart type
  • Turn on/off data series
  • Add alerts for push or email notifications when new data comes in which meets criteria you set (up to every minute or as infrequently as every month) including:
    • Percentage change (up or down)
    • Percentage increase from previous value
    • Percentage decrease from previous value
    • Absolute amount increase
    • Absolute amount decrease
    • Going above a fixed value
    • Dropping below above a fixed value
  • Sort based on X or Y values
  • See the data as a table
  • Copy the question and modify or build on it
  • Tap into specific values to see more detail
  • Save down an image of the graph
  • Export a CSV of the data

Related articles

Download Zing For Free

Available on iOS, Android, and the web

Learn how Zing can help you and your organization collaborate with data

Schedule Demo