Whether you’re curious about average basket sizes between different customer segments, or want to analyze sales trends between new and repeat customers, Zing’s new cohort feature lets you define your groups and create a comparison in seconds.
Cohorts let you define groups based on sets of filters. For example, you can create a cohort of “High-Earning Young Professionals” by defining an age range of 25-34, specifying that the country is the US, and setting household income above $100k.
This feature is more powerful than what is offered by tools such as Tableau. While Tableau restricts users to basic case statements, where an individual is only assigned to the first group they qualify for, our cohort feature allows for overlapping groups. This means you can see metrics for all the groups you’ve defined, even if they overlap.
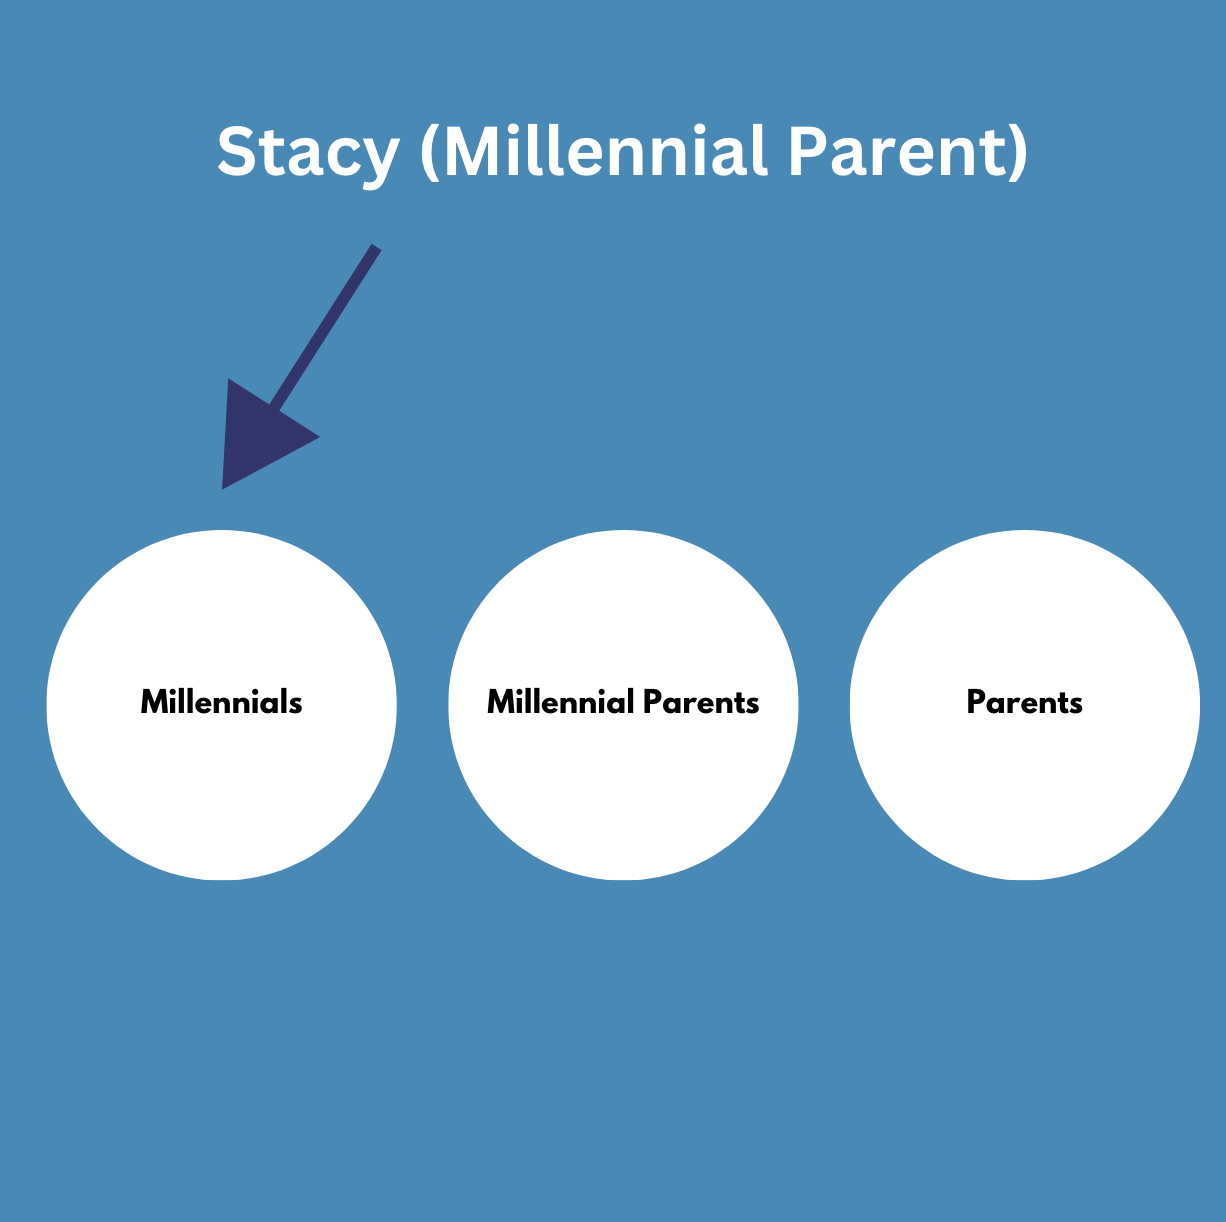
For instance, if you want to compare metrics for Millennials, Millennial parents, and parents overall, a Millennial parent would be included in all three groups simultaneously. However, with Tableau, a Millennial parent would be restricted to the first group the individual falls under.
This cohort feature enables more comprehensive and flexible comparisons.
Zing:
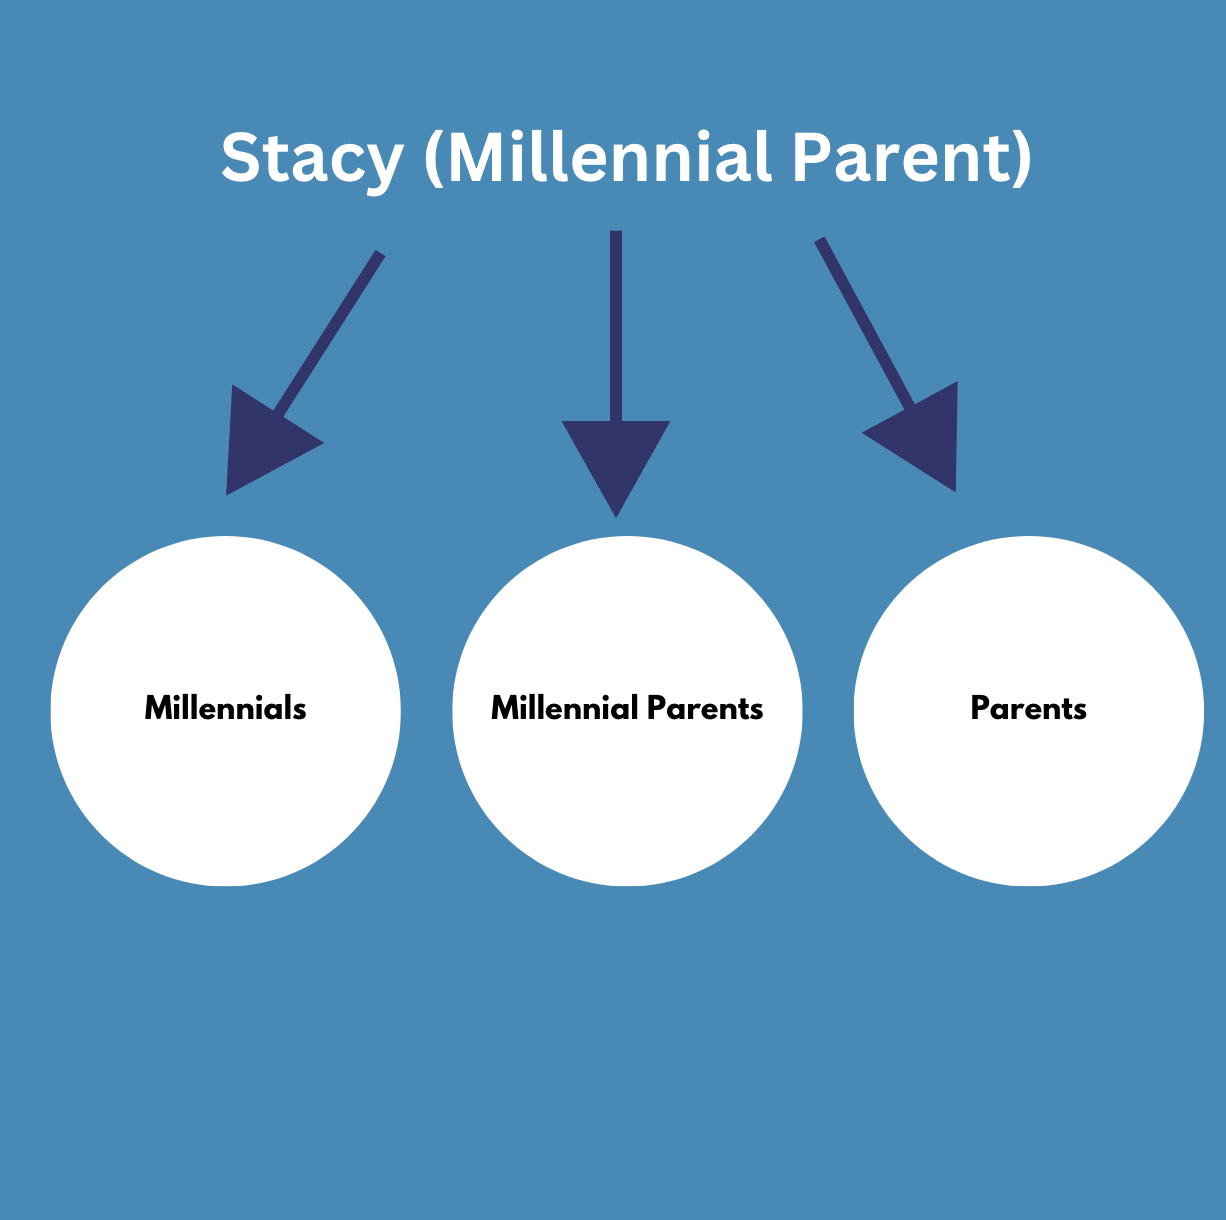
Tableau:
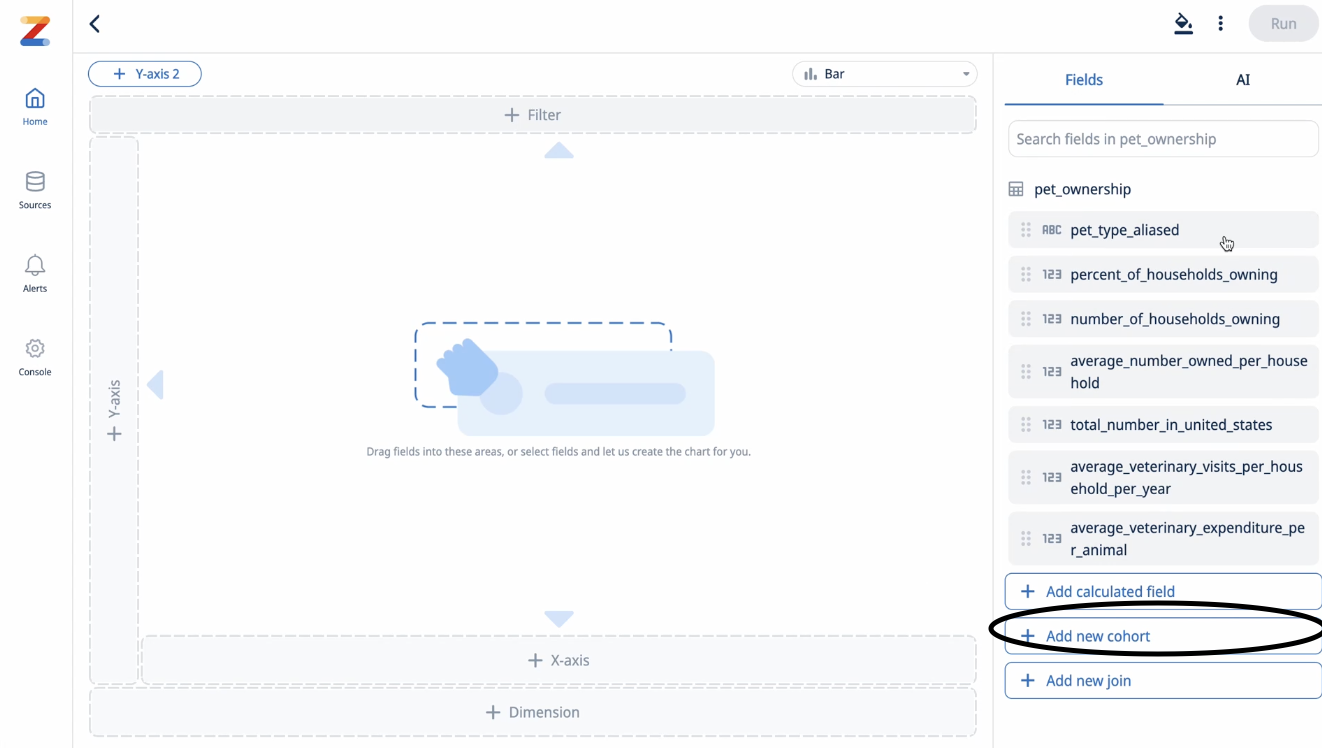
Go to Fields and click “Add New Cohort”
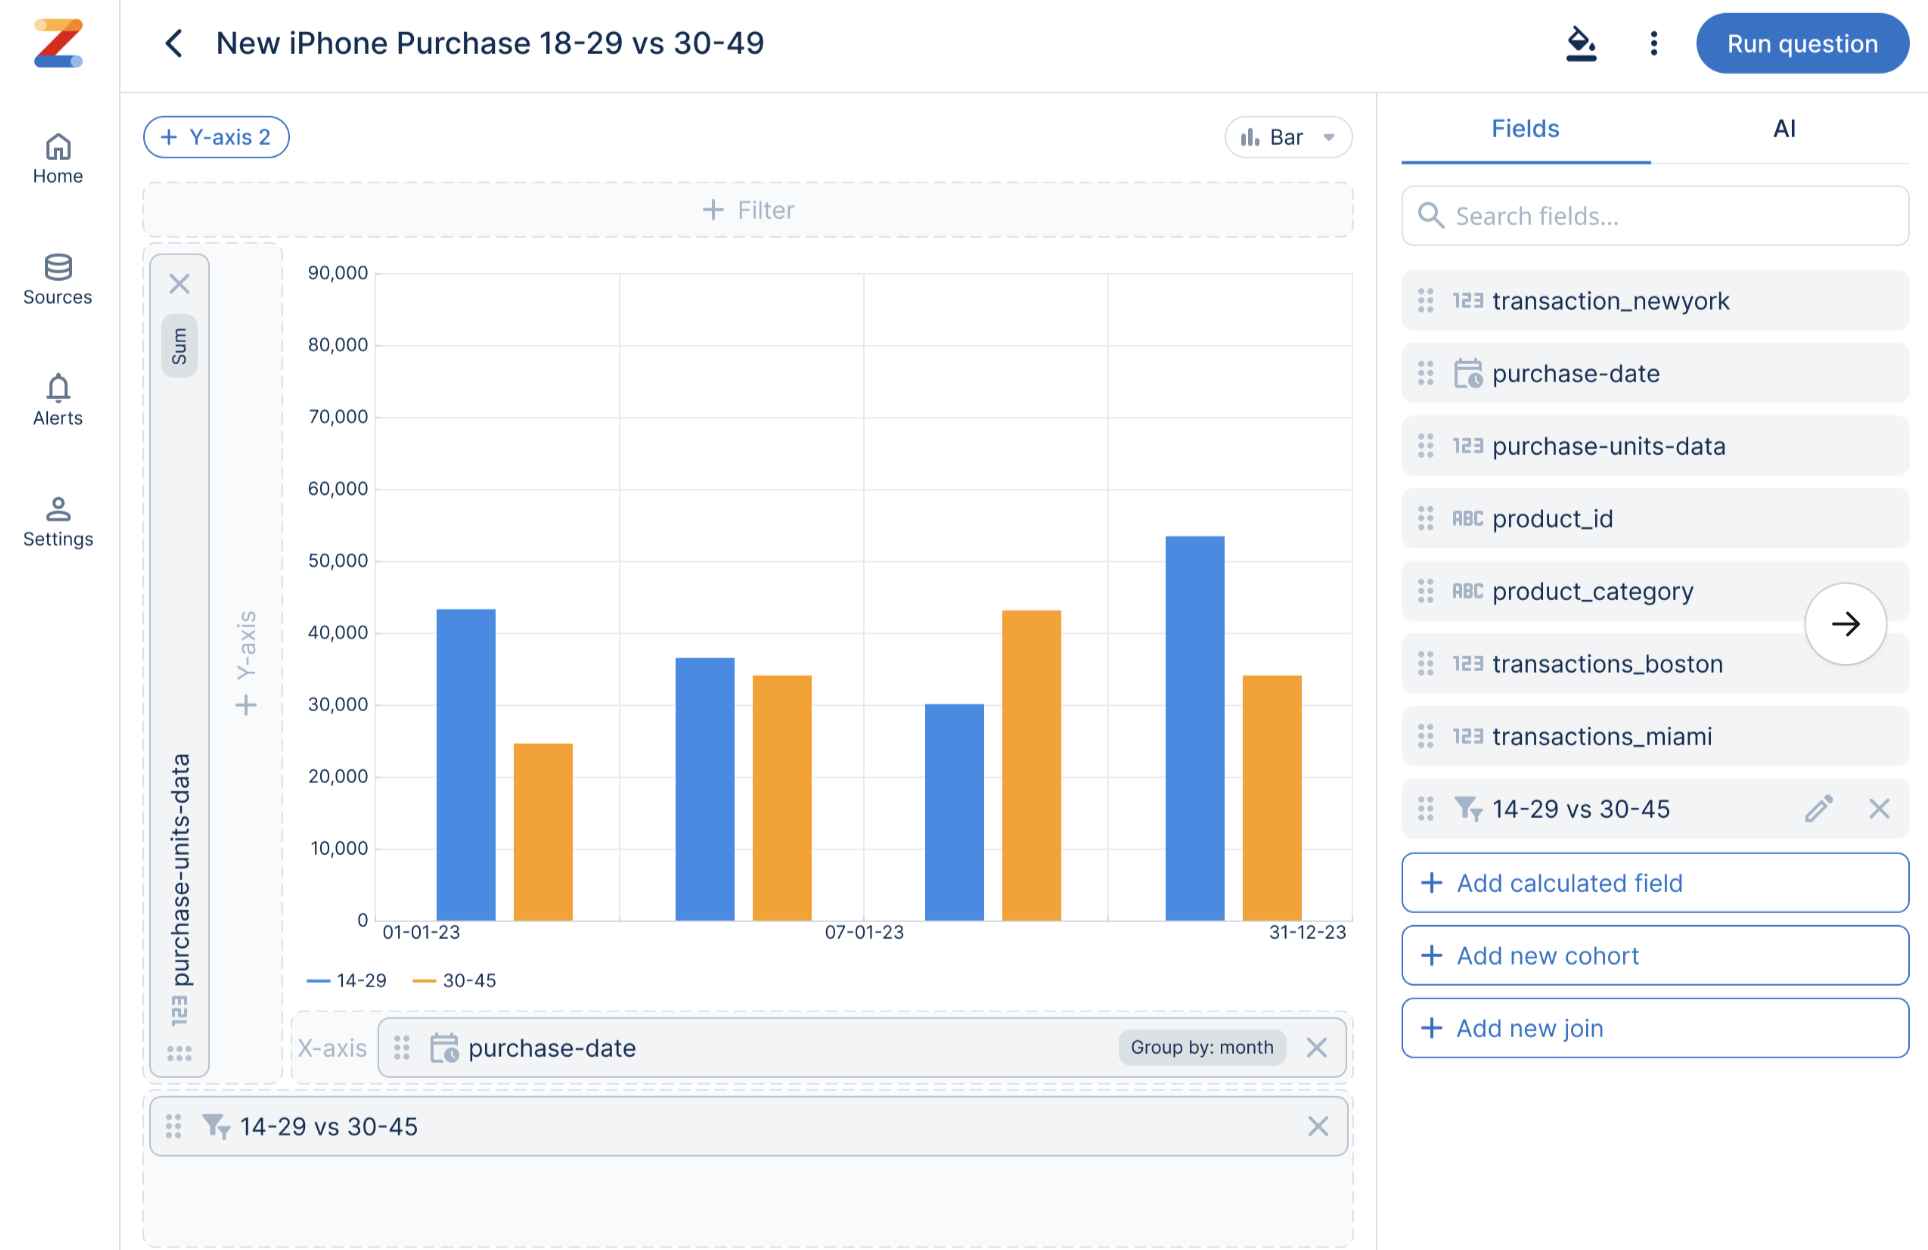
Using an existing dataset, such as information on iPhone purchases, the cohort feature lets you compare different categories by simply dragging and dropping the desired attributes. For example, to compare users between the ages of 18-29 and 30-45, just drag the relevant age attributes into your groups.
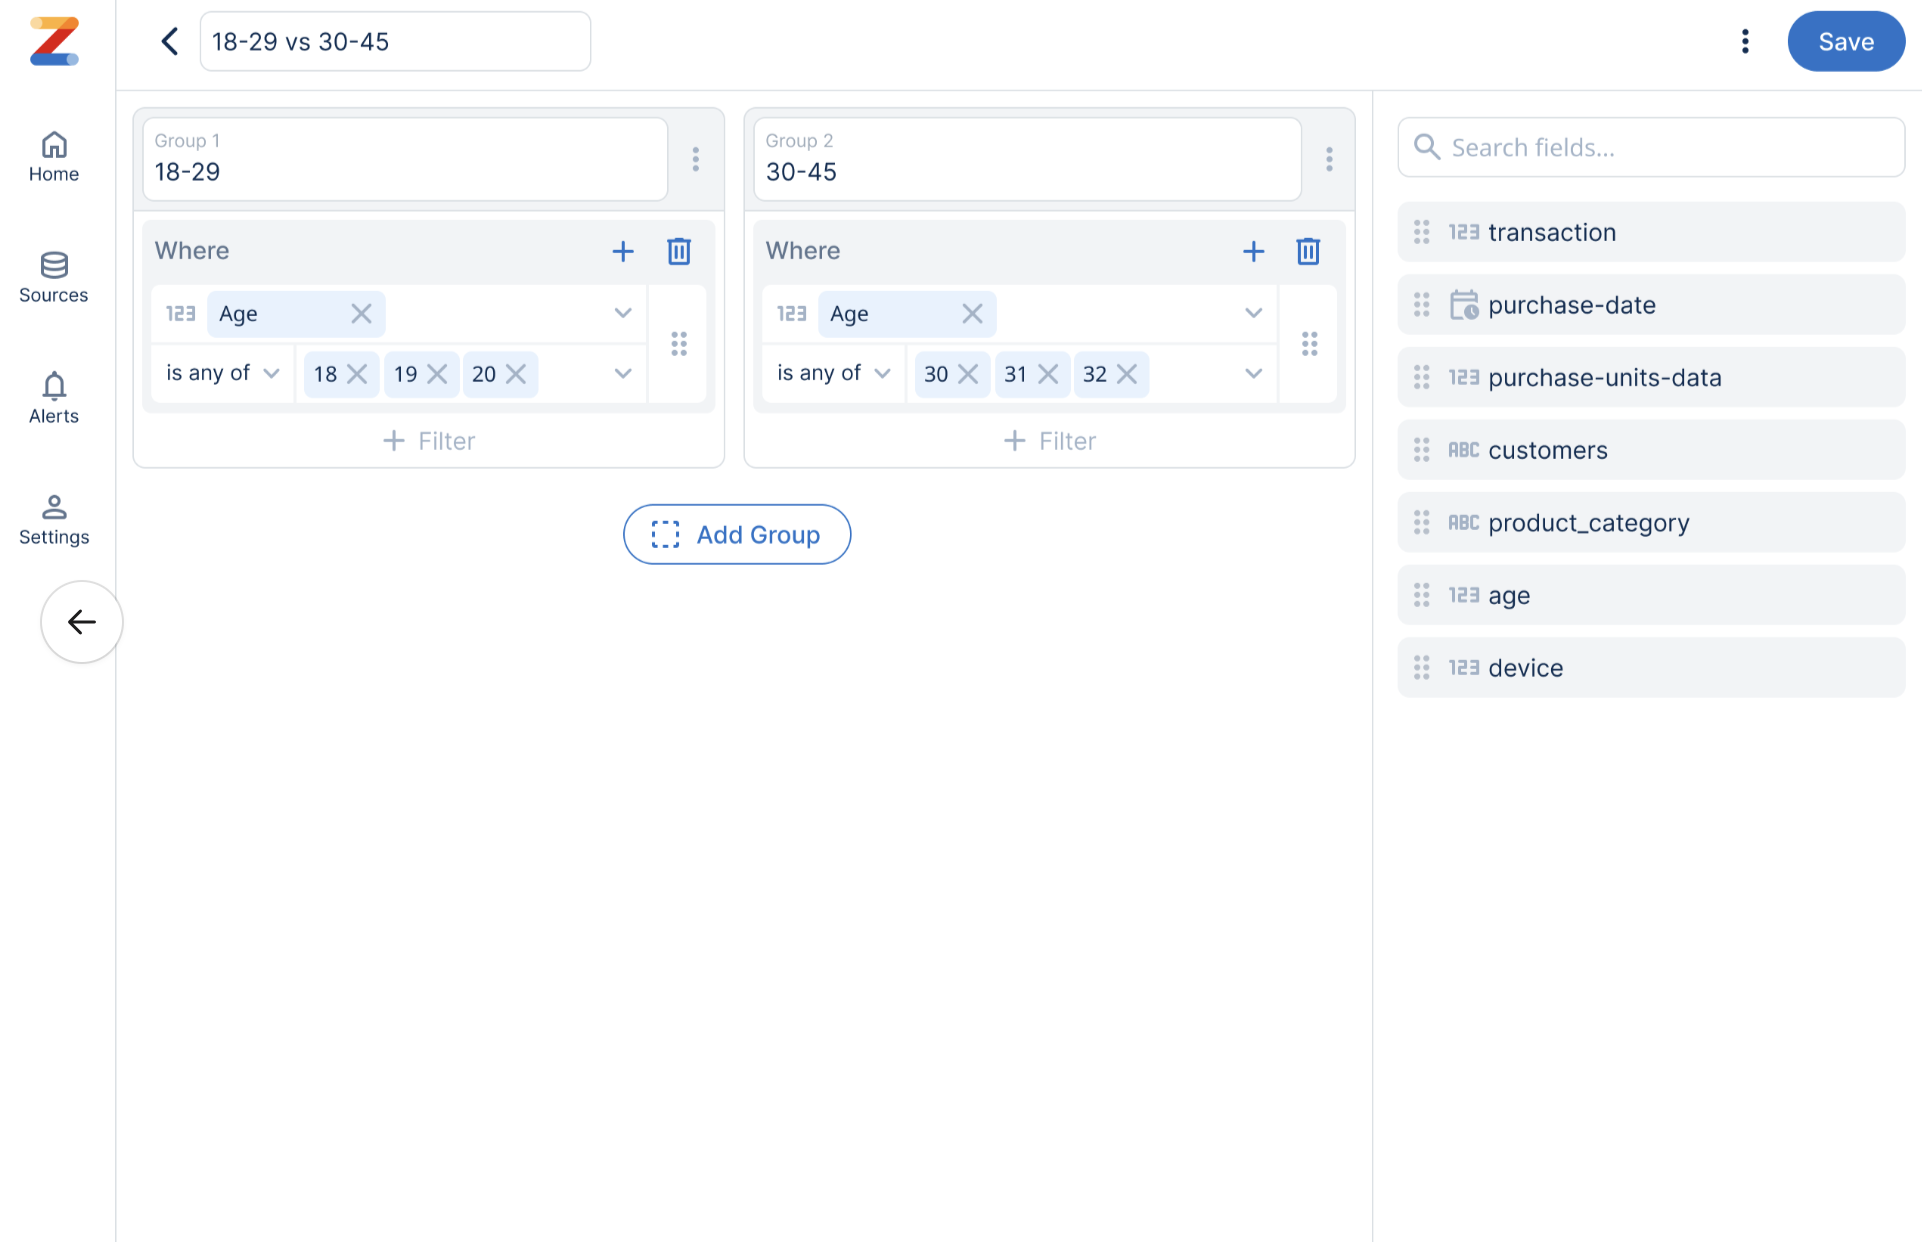
Zing will then automatically compare the data accordingly, making insights and patterns super quick and straightforward.
Save Time and Make Smarter Comparisons
Check it Out at https://getzingdata.com/
Available on iOS, Android, and the web


Learn how Zing can help you and your organization collaborate with data
Schedule Demo