Whether you’re examining daily or monthly data, understanding how it stacks up against previous periods and the same time in the previous year is crucial for spotting trends and seasonality.
We’ll compare the steps to do this in legacy BI tool Tableau (who recently announced they are shipping less frequently – from 4x/yr to 3x/yr) with Zing Data. So don’t expect Tableau’s cumbersome method to get much better anytime soon.
We timed it and Zing’s time comparisons (including the time to load a dataset, visualize it, and check it for accuracy) feature make it 4x FASTER to complete this than Tableau. And even better, Zing lets you do this all from the web or a native iOS or Android app (which Tableau doesn’t).
We start with Tableau, well known data visualization and analysis tool. We fire up Tableau Public, but even with a relatively modern Mac, it takes a bit of time to load.To get the data ready for time comparisons, we need to dive into a world of calculated fields. Our goal is to chart the number of houses sold over time, specifically on a monthly basis, but we want to look at the past year only. Tableau doesn’t offer a straightforward way to do this, so we have to create complex calculations and functions.
We delve into the Analysis tab and create calculated fields. Two calculations are needed. The first determines if a given date falls within the current or previous period. This requires conditional logic and date addition functions to check if a date falls within the last 12 months. The second handles the 13 to 24 months ago period. All these calculations are necessary to prepare the data for meaningful comparisons.
This process is time-consuming and can be quite challenging for those new to Tableau. It involves creating a flag to identify the current and previous periods and making sure that historical data lines up correctly. It’s not a simple task, and in the end, it takes around 8 minutes to set up.
We connect our Excel data source, and within moments, we’re ready to dive into data analysis. Unlike Tableau, where complex date calculations and calculations were required, Zing Data simplifies the process by automatically recognizing time fields and allowing easy comparisons on them.
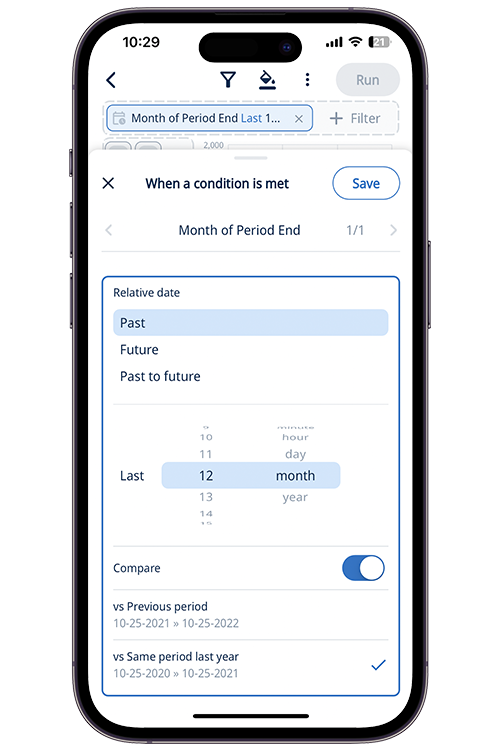
We navigate to the source we created and simply drag and drop the data elements we need. In our case, it’s the sum of homes sold over time, specifically on a monthly basis. Zing Data handles time comparisons with ease.With a few clicks, we specify that we want to look at the relative past 12 months and turn on comparisons. We can choose whether we want to compare to the same period last year or to the previous period.
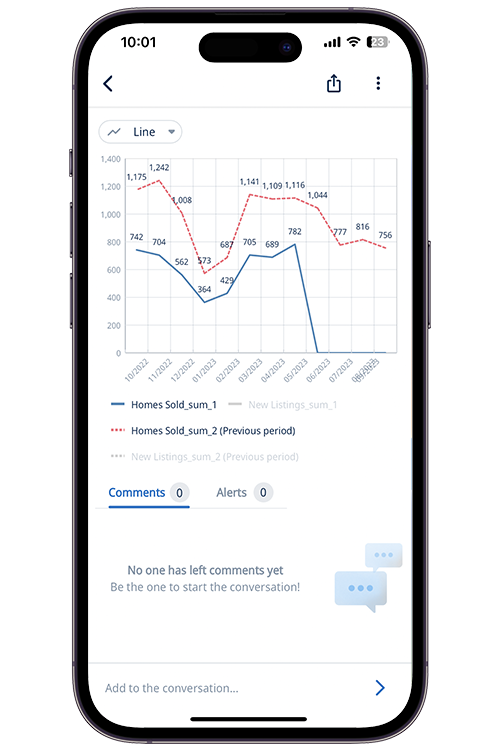
If we want to adjust the comparison period, it’s just a few clicks away. In less than two minutes, we’ve created a graph showing a comparison versus the previous period.
This was 1/4 the time it took is in Tableau, plus with Zing we could have done all of this even from mobile.

Once we save the results, we can set up alerts for changes, format the data to our liking, or even share it with colleagues.
Get started with time comparisons in Zing by simply

From here, you can set up real-time alerts, save questions to add to a dashboard, or further format your analysis.
Time comparisons are available on Zing’s basic plan and above. Get started for free at www.zingdata.com. More detailed documentation on time comparisonsis available here
Available on iOS, Android, and the web
Learn how Zing can help you and your organization collaborate with data
Schedule Demo