Visualizing Data Patterns on Maps: The Power of Geo Heat Maps
A geo heat map overlays data intensity onto a geographic map, using color to represent variations across locations. From hotspots of customer activity to cold zones of underperformance, geo heat maps make data trends instantly recognizable.
- Location-Driven Insights: Geo heat maps link data to geography, offering context that numbers alone can’t provide. They reveal regional trends, disparities, and opportunities with precision.
- Pattern Recognition at Scale: Whether you’re dealing with city blocks or entire continents, geo heat maps scale effortlessly, highlighting patterns that would otherwise be buried in spreadsheets or static charts.
- Enhanced Decision-Making: With the ability to pinpoint hotspots or cold spots, businesses can focus their efforts where it matters most—whether that’s targeting new markets, allocating resources, or mitigating risks.
Get started
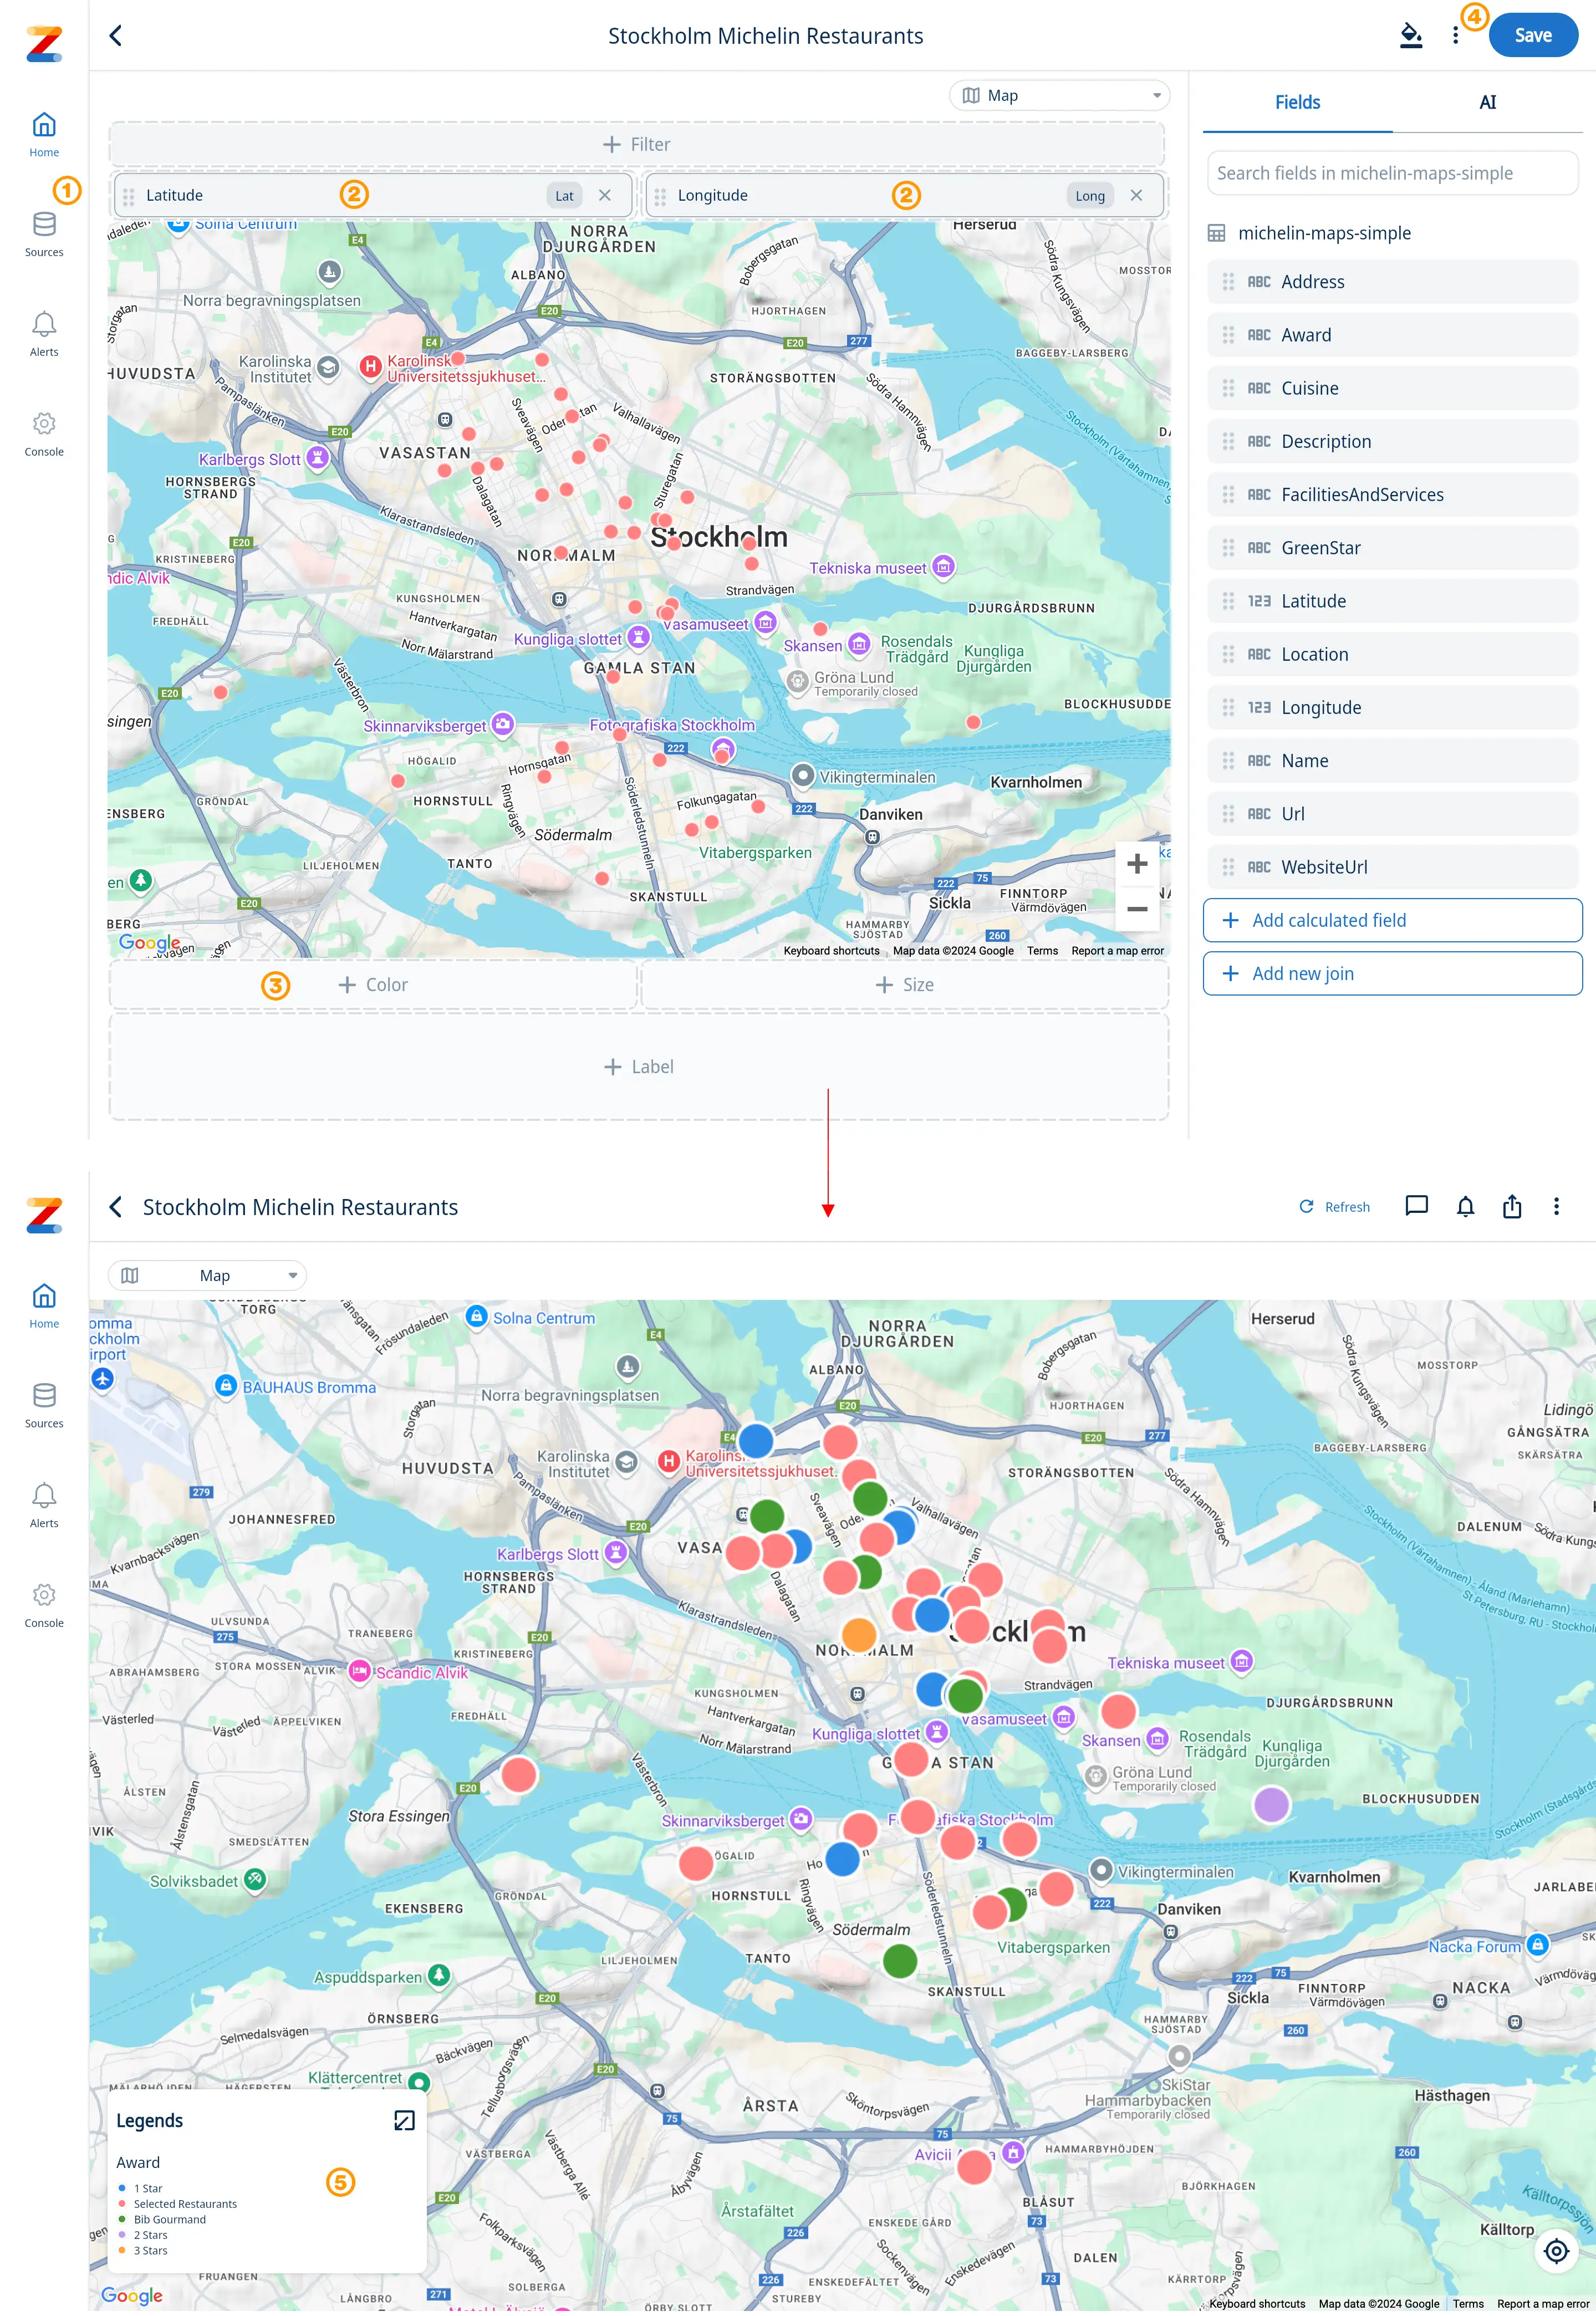
In our example below we are using a Michelin database with restaurants ratings:
- Select a data source that contains Latitude and Longitude for every location
- Select and drag the Latitude and Longitude fields into the chart builder
- Select and drag a field to separate the data by color (and size if your data supports it)
- Save your chart
- See your map with color coded data points and use the legend to quickly identify location based patterns

Potential Applications of Geo Heat Maps
- Retail and Marketing: Identify areas with high customer density and tailor local marketing campaigns. Spot underserved neighborhoods to guide store expansions.
- Supply Chain Optimization: Visualize delivery performance or inventory levels across distribution centers. Pinpoint bottlenecks or delays by region to improve operational efficiency.
- Public Health and Safety: Track disease outbreaks, identifying regions that require urgent intervention. Map crime statistics to enhance resource allocation for public safety.
- Environmental Analysis: Monitor air or water quality in different regions. Visualize the impact of environmental policies or projects on specific areas.
Get started for free! Sign In or create a new account.
To learn more please visit our documentation.
