If you’ve used pivot tables in Excel, you’re familiar with the option to see only the first element in a given category for improved readability, and the ability to display a subtotal for each group. Zing now supports this capability.With these new features, you get much of the flexibility of a spreadsheet with the power of a cloud-connected BI tool to categorize your data.
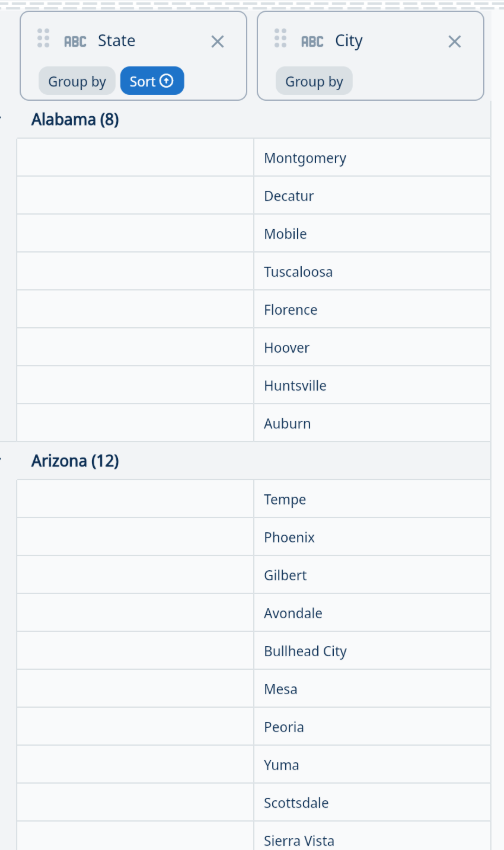
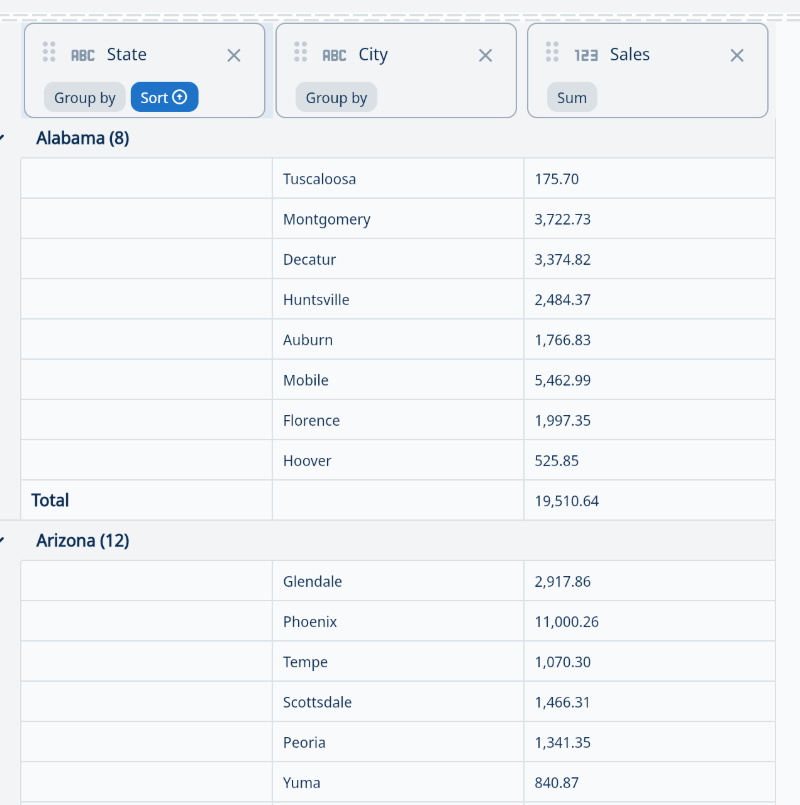
Imagine you’re looking at sales by states and cities.
For an easy-to-read table, you might not want the state name repeated for every city.
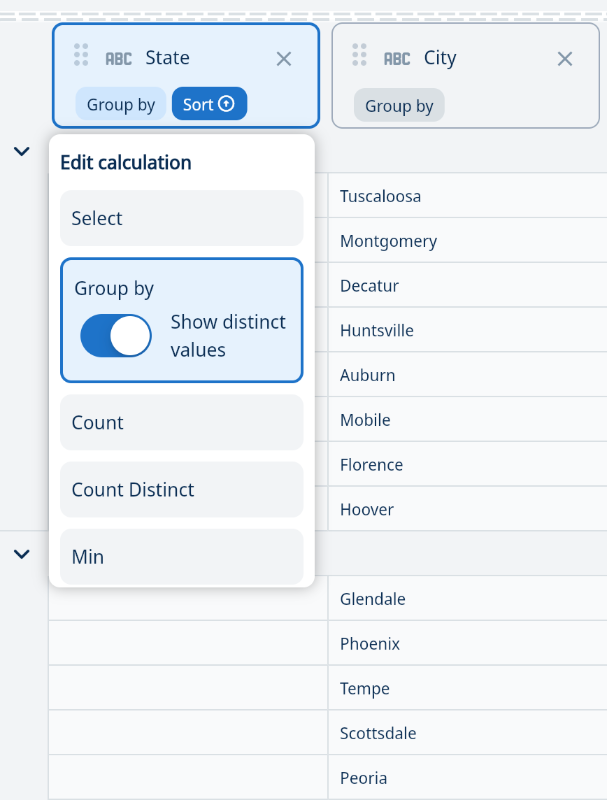
Zing’s Group By feature now lets you clearly organize the subcategory (cities) within the category (states). This way, the results are grouped without repeating the category name. Here’s how this new feature can help streamline your work.
Steps: 1. Click ‘Group By’ under the category you wish to group (ex: State) 2. Turn on ‘Show Distinct Values’
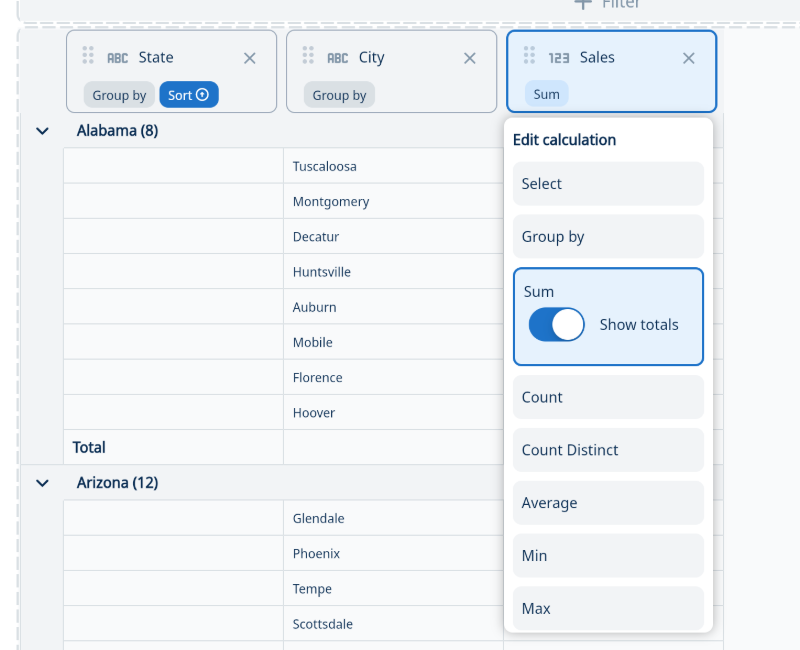
Data table grouping simplifies how your data is displayed and makes interpreting values much more straightforward. Using the Show Totals option, we can display the total sum, count, or count distinct of sales per city.
Steps: 1. Click ‘Sum’, ‘Count’, or ‘Count Distinct’ under the variable you wish to sum (ex: Sales) 2. Click ‘Show Totals’
These enhancements make your data analysis more efficient and insightful, allowing you to focus on what matters most: making informed decisions.
Check It Out at https://getzingdata.com/
Available on iOS, Android, and the web


Learn how Zing can help you and your organization collaborate with data
Schedule Demo