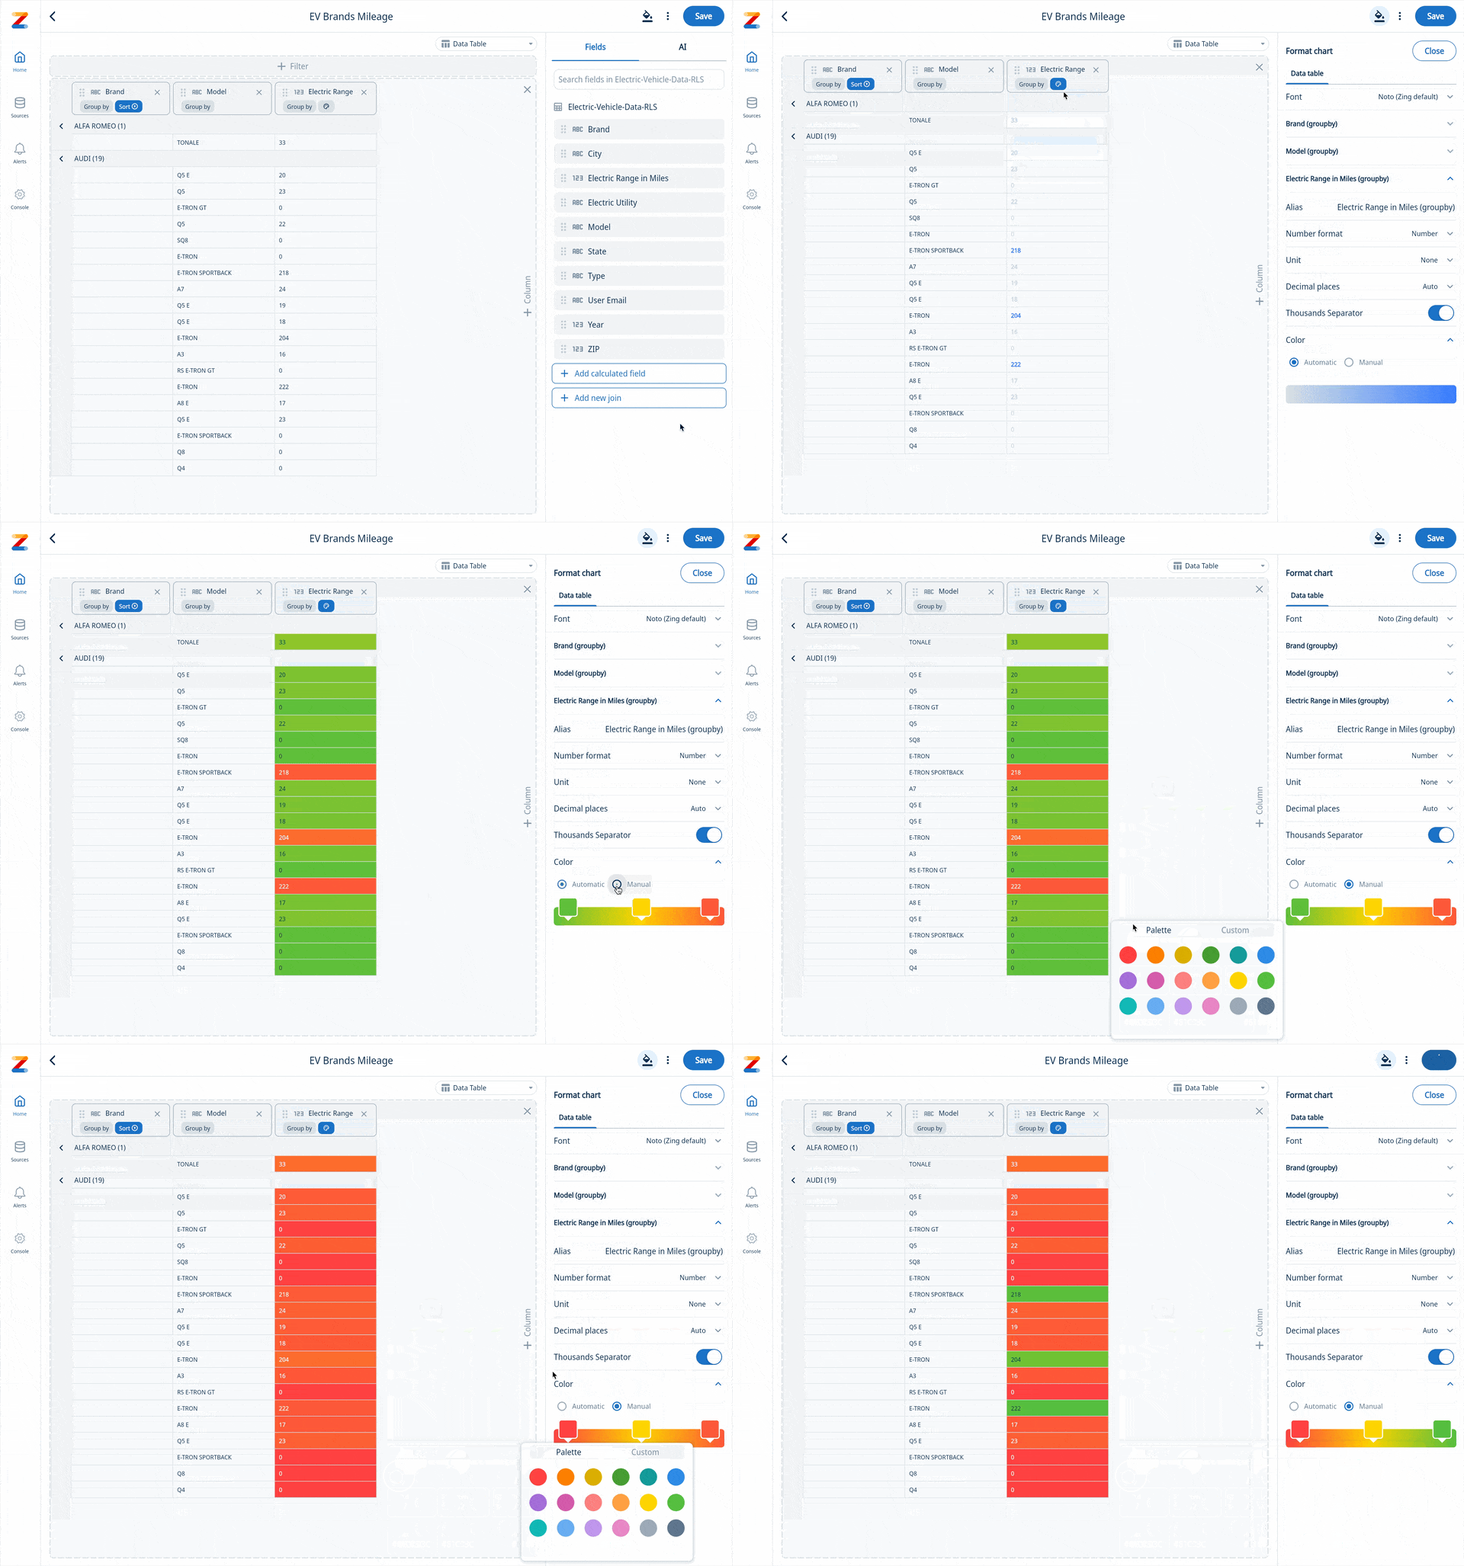
Zing now supports heatmap formatting on data tables – letting you see at a glance outlier values, and the the distribution of values. A heatmap represents data values in a table format, using varying colors to signify differences in intensity, frequency, or magnitude.

Whether you’re tracking sales performance across regions, customer funnels , or equipment reliability in industrial settings, heat maps make trends and anomalies easy to see at a glance.
- Immediate Insight: Humans process visuals far more quickly than text or numbers. A well-designed heatmap allows users to grasp patterns, outliers, and correlations at a glance.
- Actionable Clarity: By highlighting the highs, lows, and clusters of activity, heatmaps help you zero in on areas that require immediate attention or optimization.
Get started
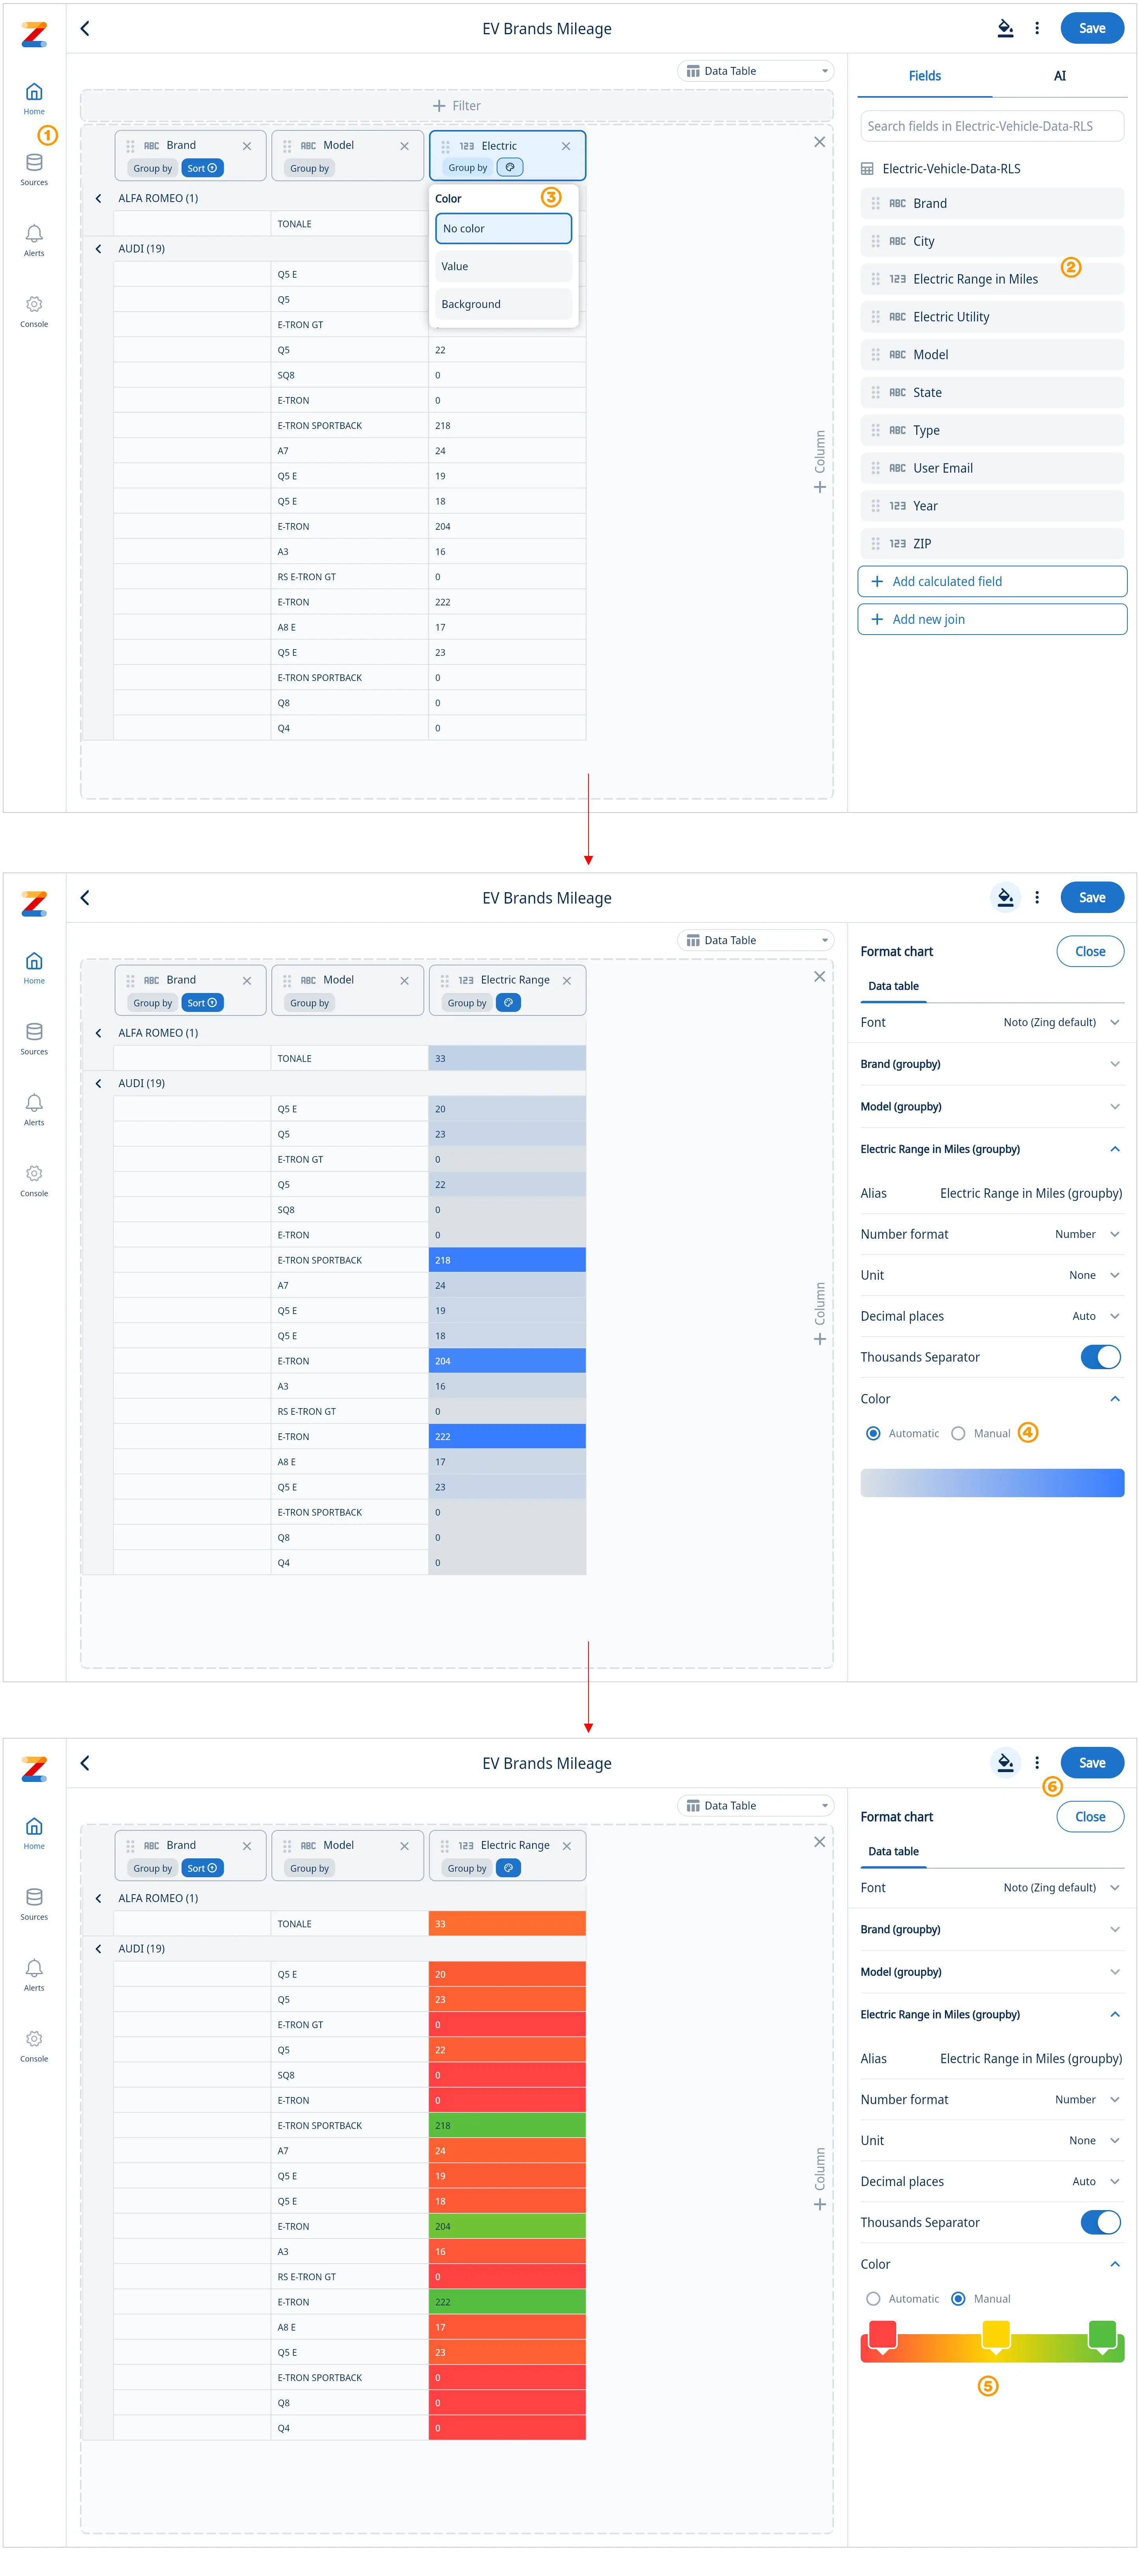
- Select a data source
- Select and drag data fields into a data table
- Click on the paint icon on a numeric column and select to highlight background cells or values
- To customize the colors of your heatmap go to format and switch to manual
- Select your custom colors to build your heatmap. You can have coloring applied to the values or to the background, and Zing will automatically ensure that the text color is legible against light or dark dark background colors
- Save your heatmap

Key Applications of Heatmaps
- Customer Analytics: Visualize user engagement on your website or app. See which pages or features drive the most interaction, helping you optimize layouts and prioritize enhancements.
- Operational Efficiency: In industries like manufacturing and logistics, heatmaps can flag bottlenecks or downtime in production lines, ensuring smooth and cost-effective operations.
- Sales Performance: Track revenue generation across geographic regions or product categories, identifying top performers and opportunities for growth.
- Resource Allocation: In healthcare or education, for example, heatmaps can pinpoint areas underserved by resources, guiding better distribution.
Get started for free! Sign In or create a new account.
To learn more please visit our documentation.

