Create a data driven workflow for your users with the perfect combination of custom SQL and AI powered search queries. Defined pathways in a structured guided search are particularly beneficial for commonly run analyses because they standardize the process, ensuring consistency and reliability in the results. By guiding users through a predefined sequence of steps, the system minimizes the risk of errors or omissions, which can be common when navigating large, complex datasets. This structure is especially useful when the analysis is routine or critical, as it ensures that all necessary data points are considered and the proper methodology is followed.
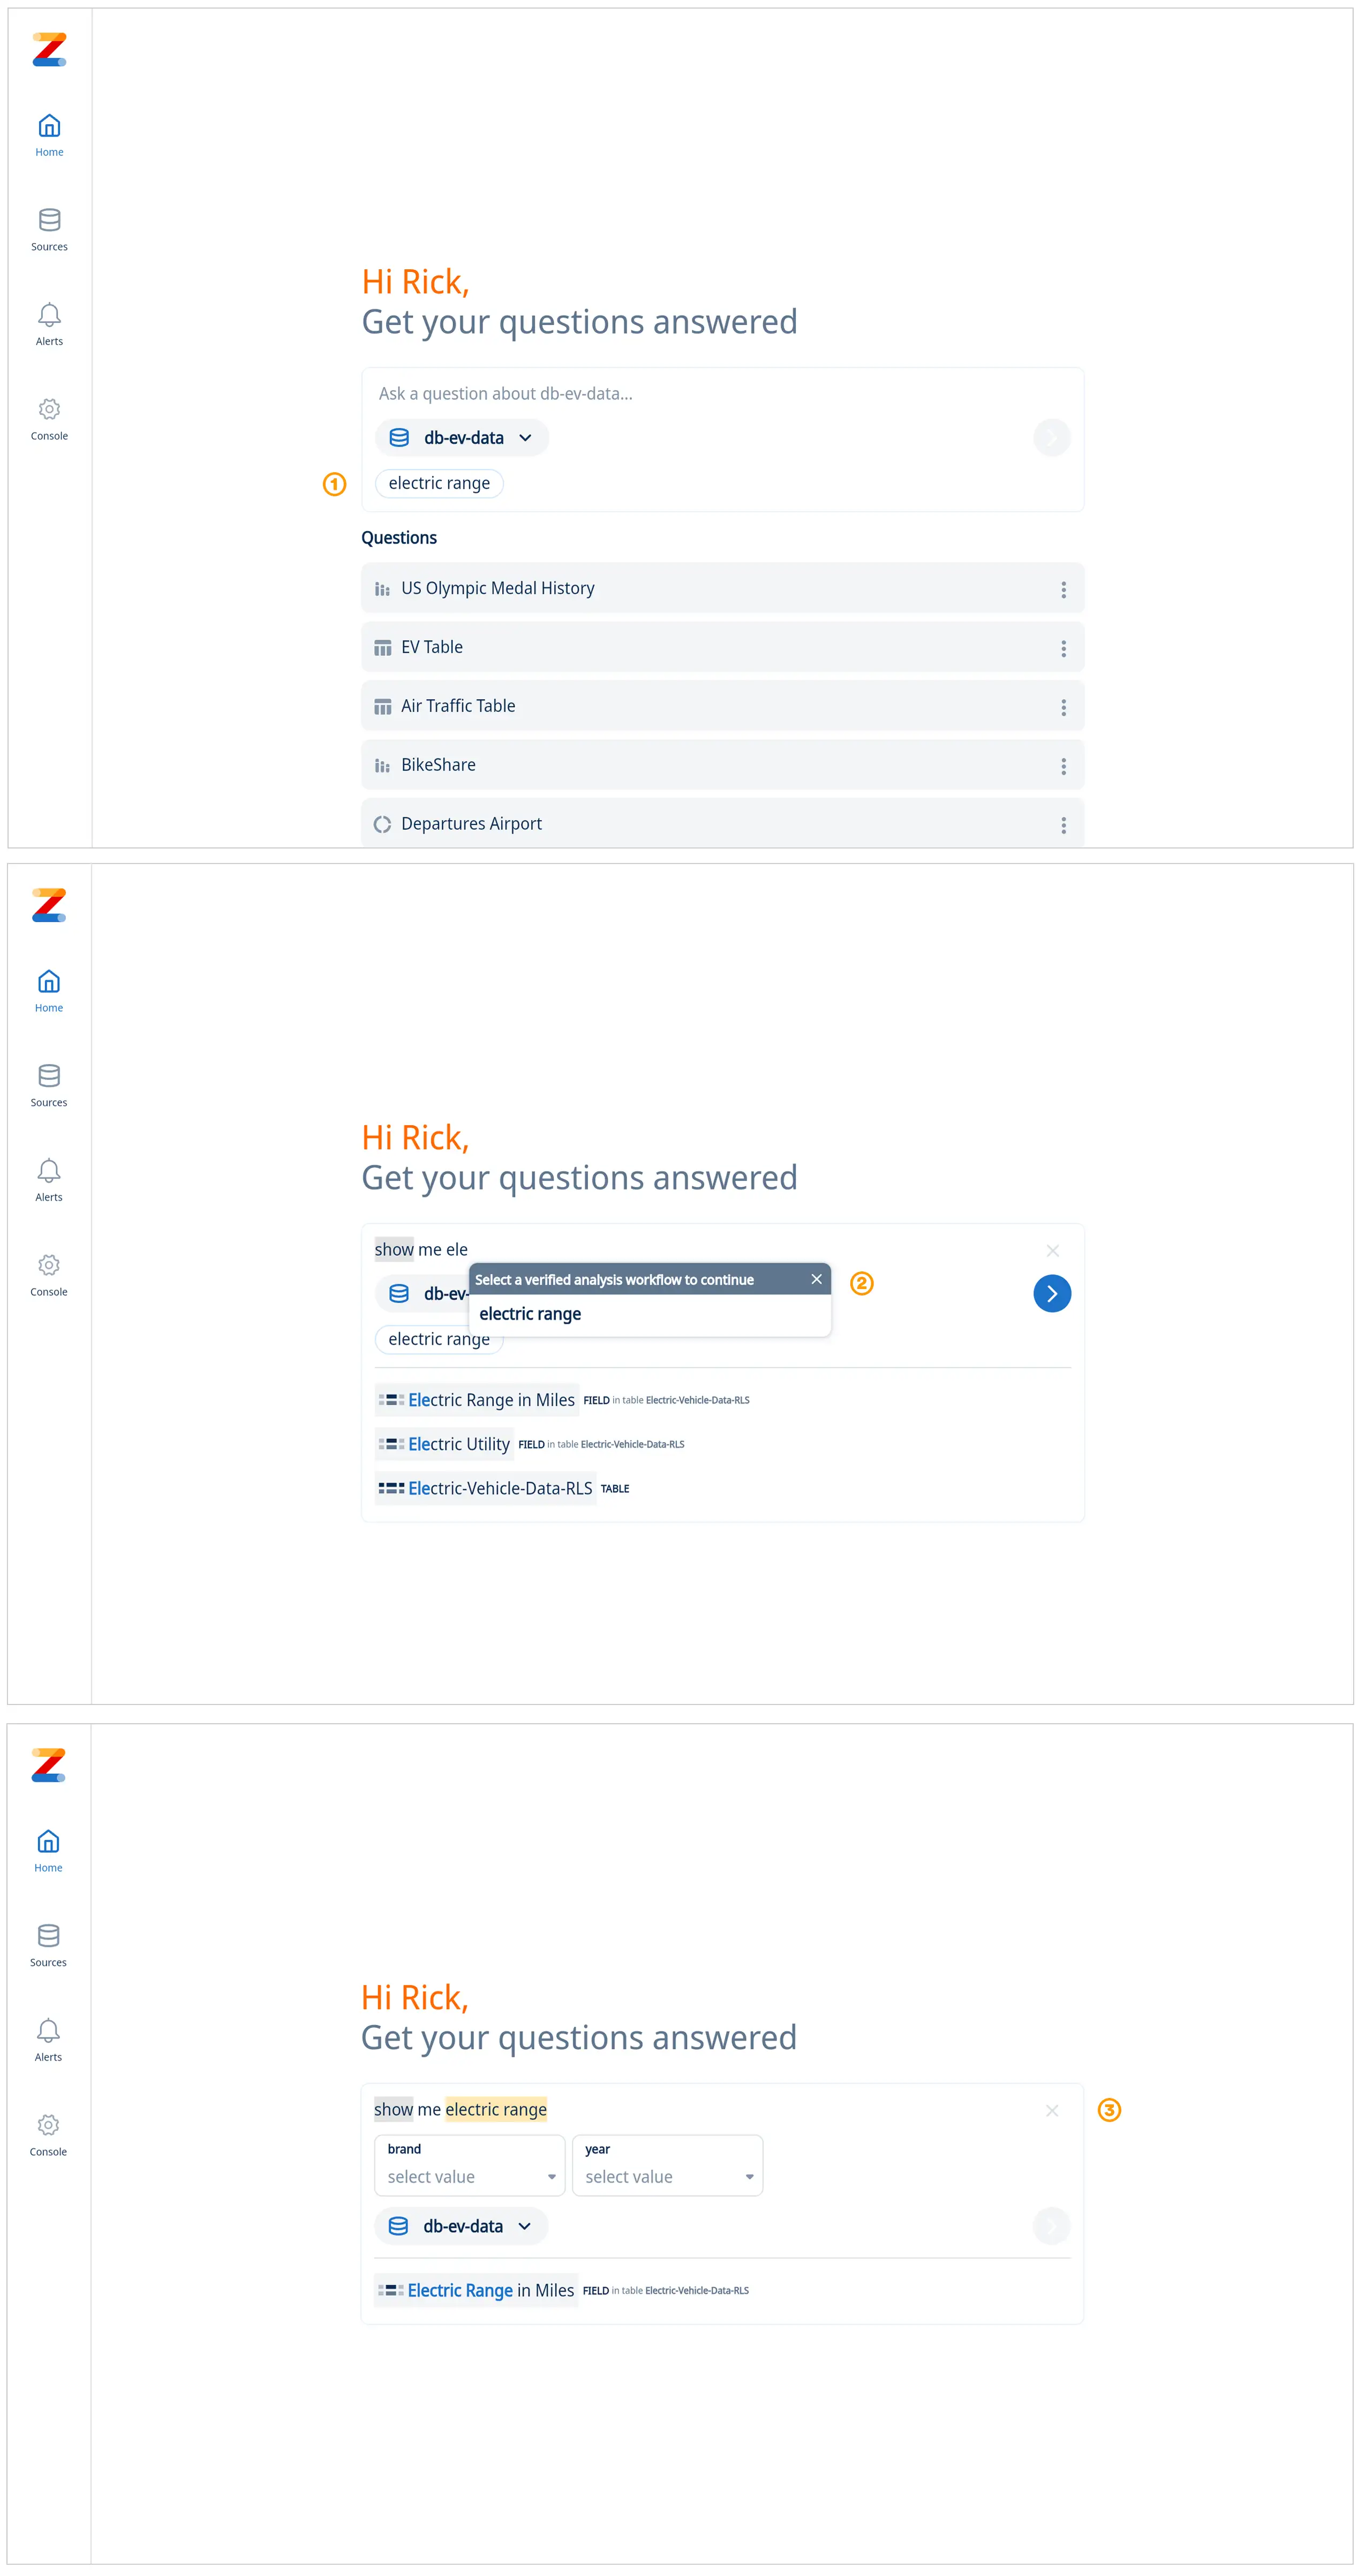
If you want a user to be able to select multiple items for an input field, your SQL will need to use the IN comparison operator instead of the = comparison operator E.G. brand IN [brand name] instead of brand = [brand name]
If a guided analysis has a lot of columns then it gets shown as a table. To ensure a field is graphed on the X-axis, add the “_x1” alias to your field in custom SQL. If you also specify “_x2" that _x2 field will be used as the ‘cut’ or ‘split’ for the x-axis field.
To ensure a field is graphed on the Y-axis, add the “_y1”, “_y2", “y3”, alias to your field name in custom SQL. The underscore and axis designation in your alias won’t show up in your graph titles, but are used to indicate which axis you want a field graphed on.
To learn more please visit our documentation:
Guided Analysis
Custom SQL
Get started for free! Sign In or create a new account.
Available on iOS, Android, and the web


Learn how Zing can help you and your organization collaborate with data
Schedule Demo