It’s the set of tools that empower people interact with data in a way that is:
Often this spans a number of steps each of which have differing tools:
Ingesting data from core sources (third parties, user interactions, transactional systems, etc.). This often involves interacting with those APIs or data sources.
Applying transformations or processing steps to standardize data. For example, transforming raw server logs into a set of performance metrics on uptime.
Updating data and storing it in a data warehouse, such as creating tables, updating tables, etc. This may also involve checking that data isn’t duplicated, that old data is dropped to conserve database storage, etc.
Connecting the data to systems to power data products, such as ranking algorithms for a feed, marketing emails targeted based on user actions etc. Depending on the approach, this can involve streaming data architectures, pushing data on a regular cadence (daily, hourly, etc.), webhooks for real-time data pushes, etc.
Visualizing the data for business intelligence, product decisions, etc.
While building new ranking models for newsfeed or modelling customer churn is likely relevant to a small number of people at a company, the one layer that can and should touch nearly every person in an organization is access to data to make better decisions – often through business intelligence tooling.
This is where the ‘old’ data stack of Tableau (founded 2003), Sisense (founded 2004), Looker (founded 2011), PowerBI (released 2011), have largely catered to the needs of companies from ten to fifteen years ago.
They are expensive, largely desktop based for asking questions – and their mobile apps are limited to viewing existing dashboards created on a desktop. Add to that per-use usage fees of $500-$1,000 per year, or server licensing costs and it’s no wonder that data is still limited to a small number of people at an organization, expensive to access, and focused on a single user at a time.
The modern data infrastructure for data visualization embraces the fact that people across an organization should have access to make better decisions using data even if they aren’t at their desk, trained as a statistician, or aren’t familiar with SQL.
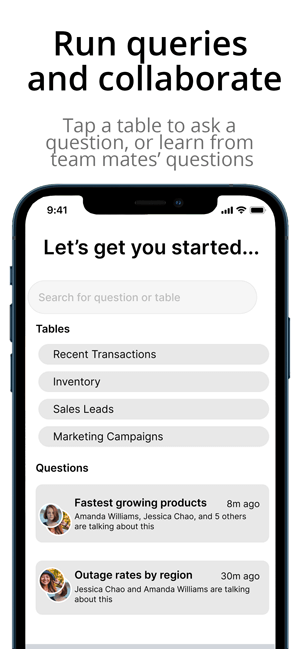
That’s why we built Zing, to make access to data from any mobile device super simple, collaborative, yet incredibly powerful. Charts and data visualizations that intelligently adapt to the results of your query. The ability to do powerful things like export data to a comma separated values file (CSV) even from your phone, or a save a graph to your camera roll to drop into a presentation from anywhere.
Sign up for Zing for free here.
Available on iOS, Android, and the web


Learn how Zing can help you and your organization collaborate with data
Schedule Demo